|
yfinance in Python is the go-to library for accessing financial data from Yahoo Finance. It simplifies the process of fetching stock data, historical market prices, and various financial statistics. This makes it an invaluable tool for data analysts, financial professionals, and developers working on financial applications. Using yfinance, users can easily obtain stock symbols, historical price data, and real-time market information with just a few lines of code.
Fetching Stock SymbolsFetching Stock Symbols with yfinance can be done in various use cases and scenarios. In this section, we will fetch stock symbols in various scenarios in terms of examples.
Example 1: Fetching Basic Stock InformationIn this example, we use the yfinance library to fetch and print basic stock information for a list of symbols. The script retrieves the stock’s name, market, and sector, handling missing data gracefully with default values of ‘N/A’.
Python
import yfinance as yf
symbols = ['MSFT', 'GOOGL', 'AMZN', 'TSLA']
for symbol in symbols:
    stock = yf.Ticker(symbol)
    info = stock.info
    print(f"Symbol: {symbol}")
    print(f"Name: {info.get('shortName', 'N/A')}")
    print(f"Market: {info.get('market', 'N/A')}")
    print(f"Sector: {info.get('sector', 'N/A')}")
    print("-" * 30)
Output:
Symbol: MSFT
Name: Microsoft Corporation
Market: N/A
Sector: Technology
------------------------------
Symbol: GOOGL
Name: Alphabet Inc.
Market: N/A
Sector: Communication Services
------------------------------
Symbol: AMZN
Name: Amazon.com, Inc.
Market: N/A
Sector: Consumer Cyclical
------------------------------
Symbol: TSLA
Name: Tesla, Inc.
Market: N/A
Sector: Consumer Cyclical
------------------------------
Example 2: Fetching Historical Stock DataIn this example, we use the yfinance library to fetch historical stock data for Amazon (AMZN) over the year 2022. The script retrieves this data and formats it for display using the tabulate library. It shows only the first and last 5 rows of data, providing a clear snapshot of the stock’s performance over the specified period.
Python
import yfinance as yf
import pandas as pd
from tabulate import tabulate

symbol = 'AMZN'
start_date = '2022-01-01'
end_date = '2022-12-31'

stock = yf.Ticker(symbol)
historical_data = stock.history(start=start_date, end=end_date)

pd.set_option('display.max_columns', None)
pd.set_option('display.width', None)

print(f"Historical Data for {symbol} from {start_date} to {end_date}")

formatted_data = pd.concat([historical_data.head(), historical_data.tail()])
print(tabulate(formatted_data, headers='keys', tablefmt='psql'))

print("\nShowing only the first and last 5 rows of data:")
print(tabulate(formatted_data, headers='keys', tablefmt='grid'))
Output:
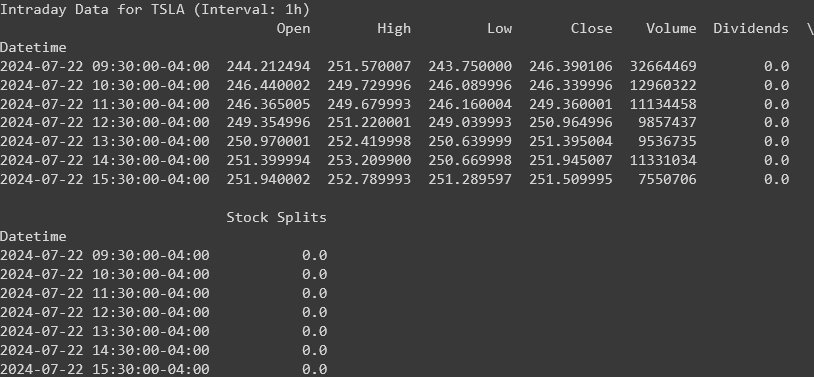
 Example 3: Fetching Stock Data with Custom IntervalsIn this example, we use the yfinance library to fetch intraday stock data for Tesla (TSLA) with a custom interval of 1 hour for the past day. The script retrieves and displays detailed hourly price data, providing a granular view of Tesla’s stock movements within the specified period.
Python
import yfinance as yf
symbol = 'TSLA'
interval = '1h'
stock = yf.Ticker(symbol)
intraday_data = stock.history(period='1d', interval=interval)

print(f"Intraday Data for {symbol} (Interval: {interval})")
print(intraday_data)
Output:
 Handling DataOnce the data are fetched using the yfinance, we can handle the data and perform various operations and visualizations on it.
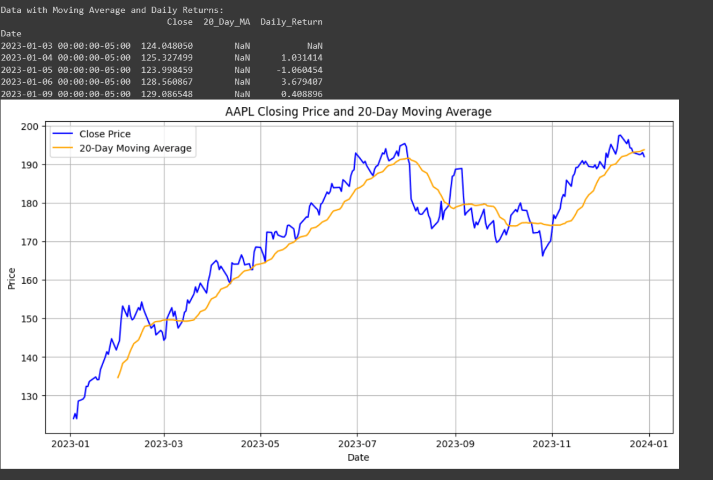
Example 1: Performing Computation on DataIn this example calculates the 20-day moving average and daily percentage return for a given stock. It then displays the data in a tabular format and plots the closing prices along with the moving average to visualize trends.
Python
import yfinance as yf
import pandas as pd
import matplotlib.pyplot as plt

symbol = 'AAPL'
start_date = '2023-01-01'
end_date = '2023-12-31'

stock = yf.Ticker(symbol)
data = stock.history(start=start_date, end=end_date)

data['20_Day_MA'] = data['Close'].rolling(window=20).mean()

data['Daily_Return'] = data['Close'].pct_change() * 100

print("Data with Moving Average and Daily Returns:")
print(data[['Close', '20_Day_MA', 'Daily_Return']].head())

plt.figure(figsize=(12, 6))
plt.plot(data['Close'], label='Close Price', color='blue')
plt.plot(data['20_Day_MA'], label='20-Day Moving Average', color='orange')
plt.title(f'{symbol} Closing Price and 20-Day Moving Average')
plt.xlabel('Date')
plt.ylabel('Price')
plt.legend()
plt.grid(True)
plt.show()
Output:
Example 2: Displaying Data in Graph FormatIn this example visualizes the closing prices and trading volumes of a stock on two different y-axes. The closing prices are plotted as a line graph, while the trading volumes are displayed as a bar chart.
Python
import yfinance as yf
import matplotlib.pyplot as plt

symbol = 'MSFT'
start_date = '2023-01-01'
end_date = '2023-12-31'

stock = yf.Ticker(symbol)
data = stock.history(start=start_date, end=end_date)

fig, ax1 = plt.subplots(figsize=(14, 7))

ax1.set_xlabel('Date')
ax1.set_ylabel('Close Price', color='tab:blue')
ax1.plot(data.index, data['Close'], color='tab:blue', label='Close Price')
ax1.tick_params(axis='y', labelcolor='tab:blue')

ax2 = ax1.twinx()
ax2.set_ylabel('Volume', color='tab:orange')
ax2.bar(data.index, data['Volume'], color='tab:orange', alpha=0.3, label='Volume')
ax2.tick_params(axis='y', labelcolor='tab:orange')

plt.title(f'{symbol} Stock Price and Volume')
fig.tight_layout()
fig.legend(loc='upper left', bbox_to_anchor=(0.1,0.9))
plt.grid(True)
plt.show()
Output:
 ConclusionIn conclusion, yfinance is a powerful and useful library for accessing and analyzing financial data from Yahoo Finance. It allows users to efficiently fetch stock symbols, historical price data, and real-time market information. By using yfinance, analysts and developers can perform detailed computations and visualizations, making it an essential tool for financial analysis and application development.
|