
|
|
Seaborn is a powerful Python library for data visualization based on Matplotlib. It provides a high-level interface for drawing attractive and informative statistical graphics. In this article, we’ll explore how to plot multiple figures in a row using Seaborn. This can be particularly useful when comparing different datasets or visualizations side by side. Table of Content Why Plot Multiple Figures in a Row?Plotting multiple figures in a row is a common requirement in data analysis and visualization. This technique enables the comparison of different datasets, variables, or models, providing valuable insights into the relationships and patterns within the data. By placing multiple plots side by side, researchers and analysts can:
Methods for Plotting Multiple FiguresTo plot multiple figures in a row using Seaborn, the primary approach is to leverage the subplot functionality provided by Matplotlib. Seaborn functions generally accept an ax parameter, which specifies the subplot where the plot should be drawn. Example 1: Simple Multiple PlotsHere’s a basic example of plotting multiple figures in a row: Output: Plot Multiple Figures in a Row Using Seaborn In this example, we created a figure with three columns and plotted different scatterplots in each column. The ax parameter of the scatterplot function specifies which subplot to use. Example 2: Using PairplotSeaborn’s pairplot function is a powerful tool for visualizing pairwise relationships in a dataset. It creates a matrix of scatterplots for all pairs of variables in a dataset, making it easy to compare different relationships simultaneously. The hue parameter can be used to add color coding based on a categorical variable, enhancing the interpretability of the plots. Output:  Plot Multiple Figures in a Row Using Seaborn pairplot is a convenient way to visualize pairwise relationships in a dataset. The hue parameter adds color encoding to distinguish different categories. Example 3: Using FacetGridFor more advanced layouts, Seaborn offers the FacetGrid class. This class allows you to create a grid of plots based on one or more categorical variables. By mapping a single plot type to multiple subsets of your dataset, FacetGrid enables the creation of complex, multi-faceted visualizations that are highly customizable. Output: .png) Plot Multiple Figures in a Row Using Seaborn FacetGrid allows you to create a grid of plots based on one or more categorical variables. In this example, we created a grid with columns for different times (lunch or dinner) and rows for smokers and non-smokers. Example 4: Using PairGrid
Output: 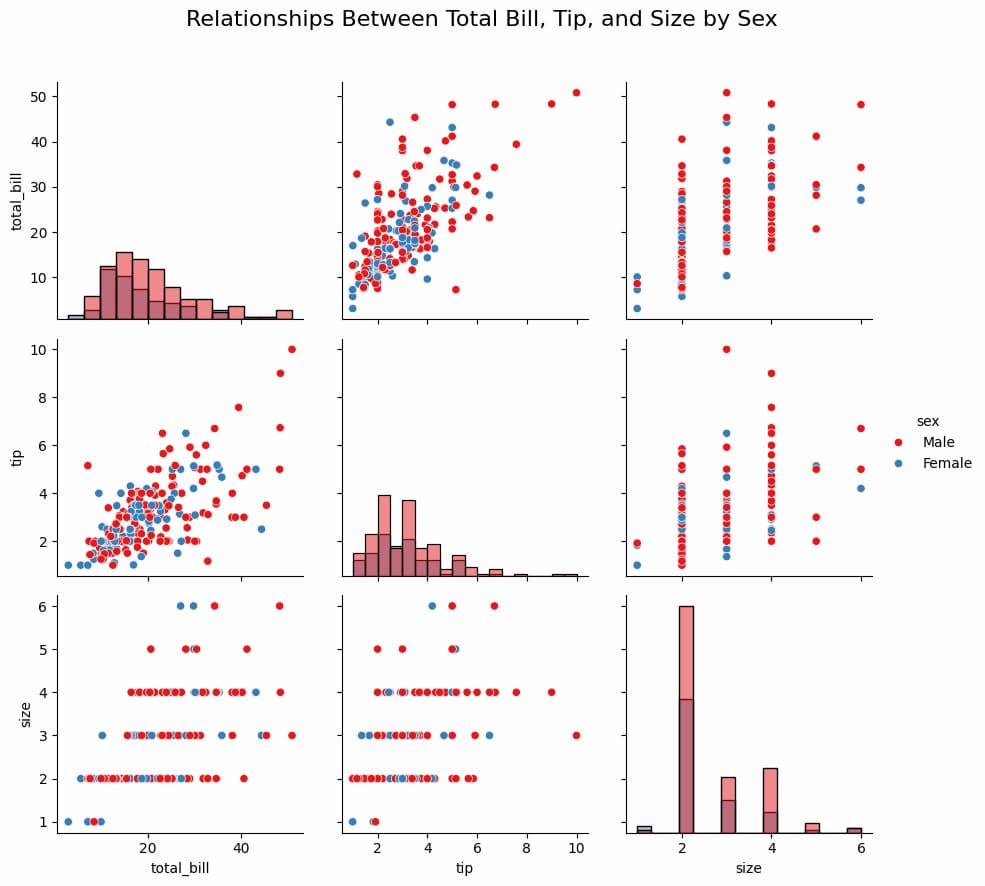 Using PairGrid Best Practices for Plotting Multiple Figures in a RowWhen plotting multiple figures in a row, it is essential to consider the following best practices:
ConclusionPlotting multiple figures in a row using Seaborn can be achieved through various methods, each offering different levels of customization and control. Whether you use |
Reffered: https://www.geeksforgeeks.org
| AI ML DS |
Type: | Geek |
Category: | Coding |
Sub Category: | Tutorial |
Uploaded by: | Admin |
Views: | 25 |