|
Seaborn is a powerful visualization library in Python that builds on top of Matplotlib. It provides a high-level interface for drawing attractive and informative statistical graphics. One of the most commonly used plots in Seaborn is the jointplot, which allows for the visualization of bivariate distributions and their marginal distributions. However, by default, Seaborn’s jointplot creates square plots, which might not always be desirable. In this article, we will explore how to create non-square jointplot or JointGrid plots in Seaborn.
Understanding Seaborn’s JointPlot and JointGridSeaborn’s jointplot is a convenient way to visualize the relationship between two variables along with their marginal distributions. However, the default behavior of creating square plots can be limiting, especially when dealing with datasets that have different scales or when you need to fit the plot into a specific layout. This article will guide you through the steps to create non-square jointplot or JointGrid plots, providing more flexibility in your data visualization tasks.
Before diving into the specifics of creating non-square plots, it is essential to understand the basics of Seaborn’s jointplot and JointGrid functions.
1. Seaborn jointplotThe jointplot function in Seaborn creates a grid of Axes with a bivariate plot in the center and univariate plots (histograms or KDEs) on the margins. Here’s a basic example:
Python
import seaborn as sns
import matplotlib.pyplot as plt

# Load the example dataset
tips = sns.load_dataset("tips")

# Create a jointplot
sns.jointplot(x="total_bill", y="tip", data=tips)
plt.show()
Output:
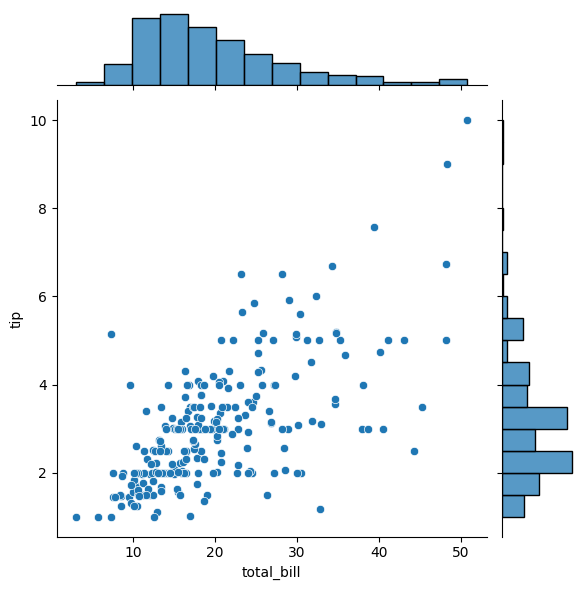 Seaborn jointplot Seaborn JointGridThe JointGrid class provides more flexibility and control compared to jointplot. It allows for more customization and the addition of more complex plots. Here’s a basic example:
Python
import seaborn as sns
import matplotlib.pyplot as plt

# Load the example dataset
tips = sns.load_dataset("tips")

# Create a JointGrid
g = sns.JointGrid(x="total_bill", y="tip", data=tips)
g = g.plot(sns.regplot, sns.histplot)
plt.show()
Output:
 Seaborn JointGrid Creating Non-Square PlotsTo create non-square plots, we need to adjust the aspect ratio of the plots. This can be achieved by modifying the figure size and the aspect ratio of the plots.
One of the simplest ways to create a non-square plot is by adjusting the figure size. You can specify the figure size using the height parameter in jointplot or by setting the fig attribute in JointGrid.
1. Using jointplot
Python
import seaborn as sns
import matplotlib.pyplot as plt

# Load the example dataset
tips = sns.load_dataset("tips")

# Create a non-square jointplot
g = sns.jointplot(x="total_bill", y="tip", data=tips, height=8, ratio=2)
plt.show()
Output:
 Using jointplot In the example above, the height parameter sets the height of the plot, and the ratio parameter controls the ratio of the joint plot size to the marginal plots.
2. Using JointGrid
Python
import seaborn as sns
import matplotlib.pyplot as plt

# Load the example dataset
tips = sns.load_dataset("tips")

# Create a JointGrid with a non-square aspect ratio
g = sns.JointGrid(x="total_bill", y="tip", data=tips, height=8)
g = g.plot(sns.regplot, sns.histplot)
g.fig.set_figwidth(12)
plt.show()
Output:
 Using JointGrid In this example, the set_figwidth method is used to set the width of the figure, creating a non-square plot.
Customizing the Aspect RatioAnother method to create non-square plots is by customizing the aspect ratio directly. This can be particularly useful when you need precise control over the plot dimensions.
Using jointplot
Python
import seaborn as sns
import matplotlib.pyplot as plt

# Load the example dataset
tips = sns.load_dataset("tips")

# Create a jointplot
g = sns.jointplot(x="total_bill", y="tip", data=tips)

# Adjust the aspect ratio
g.ax_joint.set_aspect(2)
plt.show()
Output:
 Customizing the Aspect Ratio In this example, the set_aspect method is used to set the aspect ratio of the joint plot.
Using JointGrid
Python
import seaborn as sns
import matplotlib.pyplot as plt

# Load the example dataset
tips = sns.load_dataset("tips")

# Create a JointGrid
g = sns.JointGrid(x="total_bill", y="tip", data=tips)

# Plot the data
g = g.plot(sns.regplot, sns.histplot)

# Adjust the aspect ratio
g.ax_joint.set_aspect(2)
plt.show()
Output:
 Using JointGrid Additional Customization OptionsIn addition to setting the figure size, you can further customize your joint plots by using various options available in Seaborn. For example, you can change the aspect ratio of the joint axes using the ratio parameter in the JointGrid constructor.
Python
import seaborn as sns
import matplotlib.pyplot as plt
import numpy as np
import pandas as pd

x = np.random.randn(1000)
y = 0.2 * np.random.randn(1000) + 0.5
df = pd.DataFrame(dict(x=x, y=y))

# Create the JointGrid with a custom ratio
g = sns.JointGrid(data=df, x="x", y="y", ratio=2)

# Plot the joint and marginal distributions
g.plot(sns.scatterplot, sns.histplot)
g.fig.set_figwidth(7.50)
g.fig.set_figheight(3.50)

plt.show()
Output:
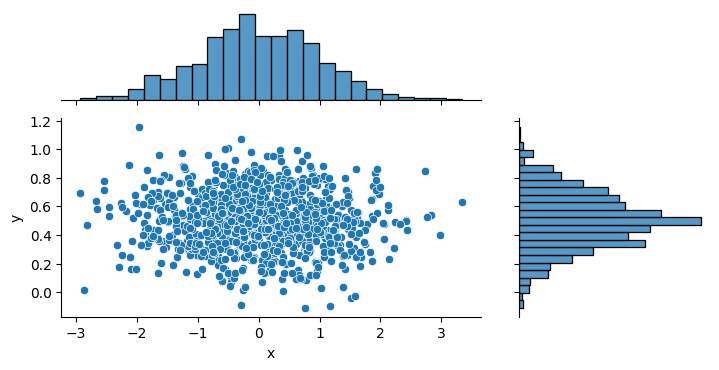 Additional Customization Options ConclusionSeaborn’s jointplot and JointGrid are powerful tools for visualizing bivariate distributions. However, the default square aspect ratio might not always be suitable for your needs. By adjusting the figure size, customizing the aspect ratio, and combining multiple plots, you can create non-square plots that better fit your data and visualization requirements. These techniques provide more flexibility and control, allowing you to create more informative and aesthetically pleasing plots.
|