|
Matplotlib is a powerful plotting library in Python that allows users to create a wide variety of static, animated, and interactive plots. One common requirement when creating plots is to adjust the figure size, especially when dealing with subplots. This article will guide you through the process of changing the figure size with subplots in Matplotlib, covering various methods and best practices.
Before diving into subplots, it’s essential to understand how figure size works in Matplotlib. The figure size is specified in inches and can be set using the figsize parameter. By default, Matplotlib creates figures with a width of 6.4 inches and a height of 4.8 inches. You can change these dimensions using the figure() function or the subplots() function.
import matplotlib.pyplot as plt

# Create a figure with a specific size
plt.figure(figsize=(8, 6))  # dimensions
plt.plot([0, 1, 2, 3, 4], [0, 1, 4, 9, 16])
plt.show()
In the example above, the figure is set to 8 inches wide and 6 inches tall.
When working with subplots, you can control the overall figure size using the figsize argument in the subplots() function. This function allows you to create a grid of subplots within a single figure.
Python
import matplotlib.pyplot as plt

# Create a 2x2 grid of subplots with a specific figure size
fig, axs = plt.subplots(2, 2, figsize=(10, 8))
axs[0, 0].plot([1, 2, 3, 4], [1, 4, 9, 16])
axs[0, 1].plot([1, 2, 3, 4], [1, 2, 3, 4])
axs[1, 0].plot([1, 2, 3, 4], [1, 3, 6, 10])
axs[1, 1].plot([1, 2, 3, 4], [10, 9, 8, 7])
plt.show()
Output:
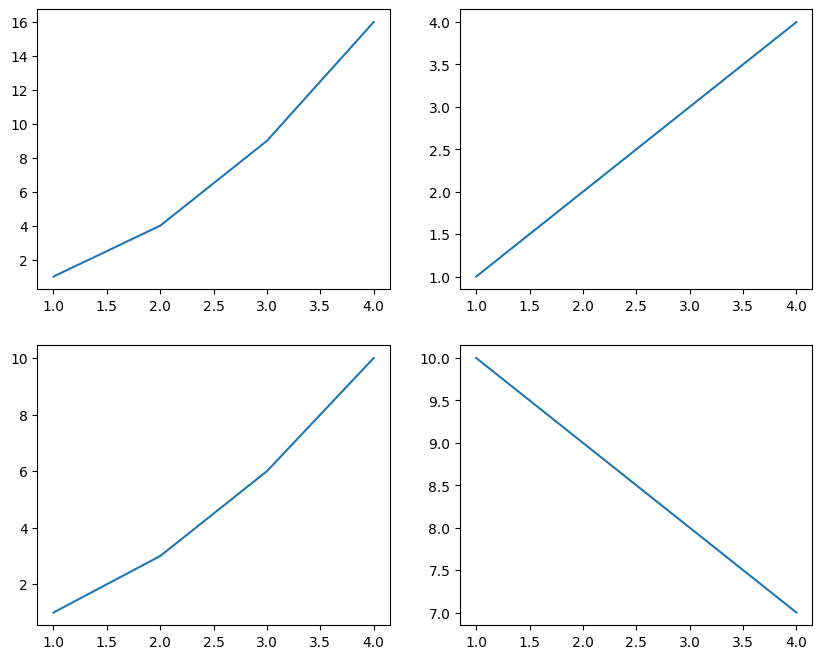 Subplots with Specific Figure Size In this case, figsize=(10, 8) tells Matplotlib to make the entire grid of plots 10 inches wide and 8 inches tall.
Fine-Tuning Subplot SizesSometimes, you may need more control over the sizes of individual subplots. Matplotlib provides several ways to achieve this, including using the gridspec_kw parameter and the set_size_inches() method.
1. Using gridspec_kwThe gridspec_kw parameter allows you to specify width and height ratios for subplots. This is useful when you want subplots to have different sizes within the same figure.
Python
import matplotlib.pyplot as plt

# Define subplots with different width ratios
fig, ax = plt.subplots(1, 2, gridspec_kw={'width_ratios': [3, 1]})
fig.tight_layout()

# Plot data in each subplot
ax[0].plot([1, 2, 3], [7, 13, 24], color='red')
ax[1].plot([1, 2, 3], [7, 13, 24], color='blue')
plt.show()
Output:
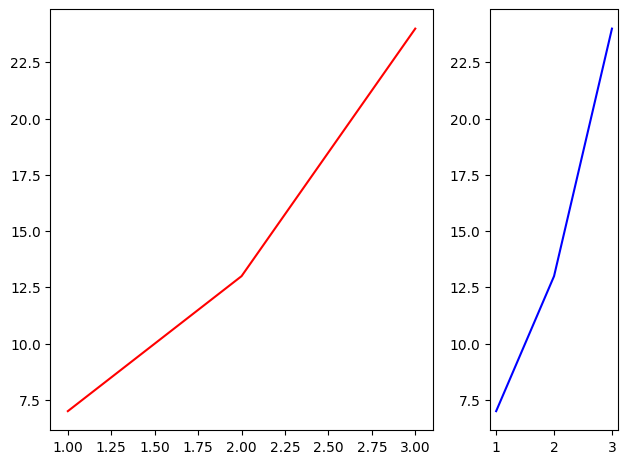 Using gridspec_kw In this example, the first subplot is three times wider than the second subplot.
2. Using set_size_inches()If you need to adjust the figure size dynamically after creating the plots, you can use the set_size_inches() method.
Python
import matplotlib.pyplot as plt

# Create a figure and plot some data
fig, ax = plt.subplots()
ax.plot([1, 2, 3, 4], [1, 4, 9, 16])

# Dynamically adjust the figure size
fig.set_size_inches(4,3)
plt.show()
Output:
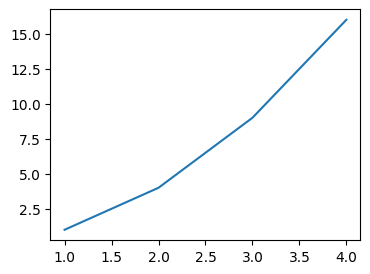 Using set_size_inches() Let’s create a more complex figure with various subplots and customized sizes to demonstrate the concepts discussed.
Python
import matplotlib.pyplot as plt
import numpy as np

x = np.linspace(0, 2 * np.pi, 400)
y = np.sin(x ** 2)

# Create a figure with a 2x2 grid of subplots
fig, axs = plt.subplots(2, 2, figsize=(12, 10))

# Plot data in each subplot
axs[0, 0].plot(x, y)
axs[0, 0].set_title('Plot 1')

axs[0, 1].scatter(x, y)
axs[0, 1].set_title('Plot 2')

axs[1, 0].pie(x, np.abs(y))
axs[1, 0].set_title('Plot 3')

axs[1, 1].hist(y, bins=30)
axs[1, 1].set_title('Plot 4')

fig.tight_layout()
plt.show()
Output:
.jpg) Creating a Complex Figure with Subplots In this example, we create a 2×2 grid of subplots with different types of plots (line plot, scatter plot, bar plot, and histogram). The figsize parameter ensures that the figure is large enough to accommodate all subplots without overlapping.
Best Practices for Adjusting Subplot SizesWhen adjusting subplot sizes, it’s essential to consider the following best practices to ensure your plots are clear and effective:
- Maintain Aspect Ratio: Ensure that the aspect ratio of your plots is appropriate for the data being displayed. Distorted plots can mislead the interpretation of data.
- Use Tight Layouts: Use
fig.tight_layout() to automatically adjust subplot parameters to give specified padding. This prevents subplots from overlapping. - Consistent Sizes: Keep subplot sizes consistent when comparing similar data sets. This makes it easier to compare plots side by side.
- Readability: Ensure that labels, titles, and legends are readable. Adjust the figure size if necessary to prevent cluttering.
ConclusionAdjusting the figure size with subplots in Matplotlib is a crucial skill for creating effective and visually appealing plots. By understanding how to use the figsize parameter, gridspec_kw, and set_size_inches(), you can customize your plots to fit your specific needs. Remember to follow best practices to maintain readability and clarity in your visualizations.
|