
|
|
Pyvista is an open-source library provided by Python programming language. It is used for 3D plotting and mesh analysis. It also provides high-level API to simplify the process of visualizing and analyzing 3D data and helps scientists and other working professionals in their field to visualize the data graphically. It has various applications from computational fluid mechanics to medical imaging and much more. Key Features of PyVistaLet us take a look at the key features of Pyvista. User-friendly API: Pyvista offers a user-friendly API that abstracts the Visualization Toolkit (VTK) complexities, allowing users to create complex structures in minimum time and least code. Comprehensive Mesh Support: The library supports various mesh types, including structured and unstructured grids, point clouds, and surface meshes, making it versatile for different applications. Interactive Plotting: Another important feature of the Pyvista is that it can get integrated with Jupyter notebooks very easily and using that we can create very interactive plotting. These features finally helps user to interact and understand their data in an appropriate and easier manner. Robust Data Processing: Pyvista provides tools for data manipulation, filtering, and analysis, making it a comprehensive solution for 3D data processing. Installing PyvistaBefore using Pyvista, you need to install it on your system. The installation process is straightforward using Python’s package manager, pip. You can simply open our windows power shell or terminal and write the following command and press enter. Once it is done, Pyvista will be automatically installed on your system. pip install pyvistaPyvista Installation Pyvista Installation VerificationIf you want to check if Pyvista is properly installed and check the version installed on your system, you can do so by writing a simple Python script. The __version__ method tells the current version of the package installed on your system. Output: 0.44.0Uses of PyvistaFollowing are the basic usage of the Pyvista: 3D Data Visualization: Pyvista is used to create interactive 3D graphs and other visualization. Using Pyvista we can simplify the complex data into understandable graphical data. It simplifies the process of generating plots for 3D datasets Mesh Analysis and Manipulation: Pyvista allows users to load, process, and analyze various types of mesh data. This includes tasks like mesh decimation (reducing the number of polygons), smoothing, and extracting surface features. Finite Element Analysis (FEA): Engineers use Pyvista to visualize results from FEA simulations. This includes displaying stress, strain, and deformation fields on complex 3D models. Computational Fluid Dynamics (CFD): Pyvista is used to visualize fluid flow simulations, such as velocity fields, pressure distributions, and other important parameters in CFD studies. Educational Purposes: It can also be used for educational purposes such as teaching and demonstrating complex visual concepts to the students. ExampleIn this example, we will create a simple 3D sphere using the Pyvista module. The Shpere() function is used to create a 3D sphere object. The Plotter() function is used to set up the plotter. After the plotter is set, we will add the mesh to our sphere using the add_mesh() function. In this function, we will pass the sphere object and specify the desired color of the object. The show() function is then used to display the visualization. Output: 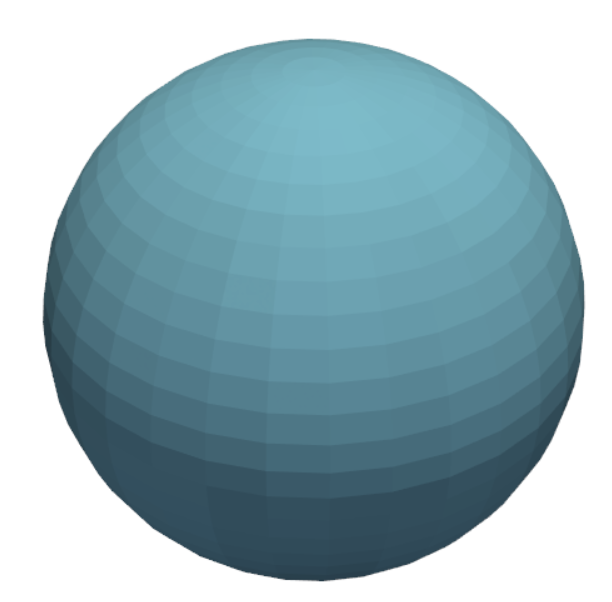 Advantages of using Pyvista
FAQsQ: Can I use Pyvista with Jupyter notebooks?
Q: Does Pyvista support parallel processing?
Q: What file formats does Pyvista support?
Q: Where can I find more examples and documentation?
|
Reffered: https://www.geeksforgeeks.org
| Python |
| Related |
|---|
| |
| |
| |
| |
| |
Type: | Geek |
Category: | Coding |
Sub Category: | Tutorial |
Uploaded by: | Admin |
Views: | 18 |