
|
|
In this article, we will explore how to generate and print the plots created within the function using R Markdown in RStudio. R Markdown is a powerful tool for creating dynamic documents that integrate code, results, and narrative text. We will demonstrate how to create the plot within the R function and then print that plot in an R Markdown document. Prerequisites
Creating a Plot in a FunctionWe can create a simple function in the R that generates a plot. We will use the ggplot2 package for creating the plot. Output: Printing plots generated in a function using R Markdown in RStudio Printing plots generated in a function using R MarkdownR Markdown can allows you to create the documents that certain the mixture of the markdown text and embedded R code. To create the R Markdown document in the RStudio.
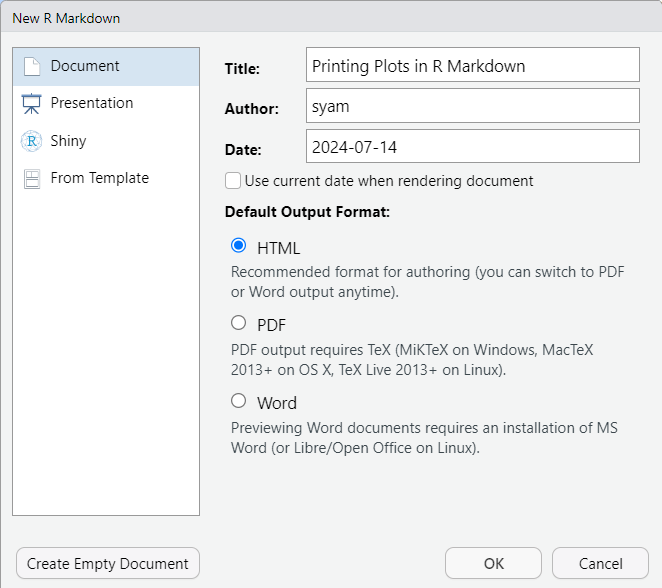 Printing plots generated in a function using R Markdown in RStudio Printing the Plots in R MarkdownTo print the plots generated within the function in an R Markdown documents paste this the R Markdown section: ---
title: "Printing Plots in R Markdown"
author: "syam"
date: "2024-07-14"
output: html_document
---
```{r setup, include=FALSE}
knitr::opts_chunk$set(echo = TRUE)
```Output: R Markdown HTML Result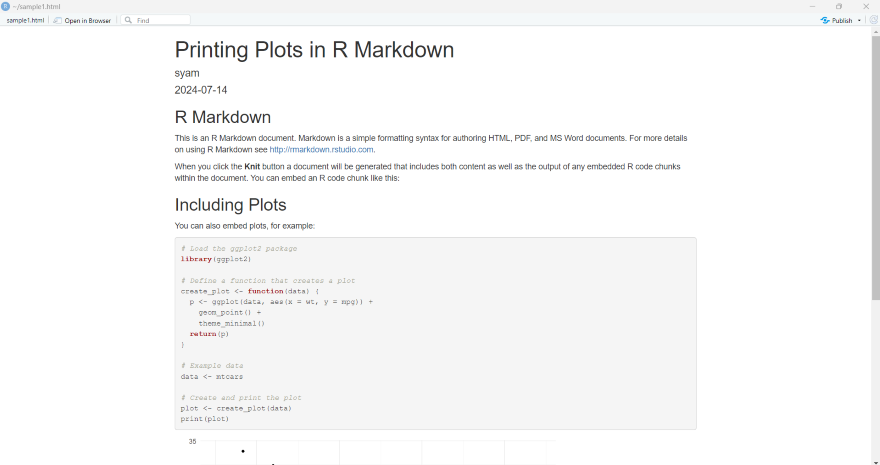 Printing plots generated in a function using R Markdown in RStudio 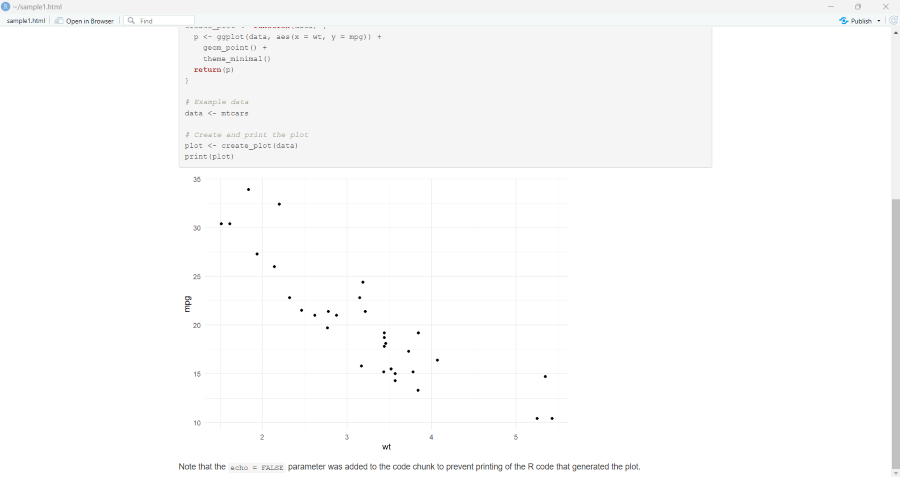 Printing plots generated in a function using R Markdown in RStudio ConclusionUsing the R Markdown, we can seamlessly integrate the R code, results and narrative text into the single document. This article demonstrated how to create and print the plots generated within the function using R Markdown in RStudio. |
Reffered: https://www.geeksforgeeks.org
| R Language |
Type: | Geek |
Category: | Coding |
Sub Category: | Tutorial |
Uploaded by: | Admin |
Views: | 21 |