
|
|
Tree-based methods are powerful tools for both classification and regression tasks in machine learning. The caret package in R provides a consistent interface for training, tuning, and evaluating various machine learning models, including decision trees. In this article, we will walk through the steps to create a tree plot using the caret package. What is a Tree Plot?A tree plot, also known as a decision tree plot is a visual representation of a decision tree used in machine learning and statistical analysis. Decision trees are a type of model used for classification and regression tasks, where data is split into branches based on feature values to make predictions. Setting Up the EnvironmentFirst, ensure you have the necessary packages installed and loaded. # Load the libraries
library(caret)
library(rpart)
library(rpart.plot)Now we will discuss making a Tree Plot in the Caret Package using R Programming Language. Step 1: Loading and Preparing the DataWe’ll use the Iris dataset for this example. This dataset contains measurements of iris flowers from three different species. Output: Sepal.Length Sepal.Width Petal.Length Petal.Width Species
1 5.1 3.5 1.4 0.2 setosa
2 4.9 3.0 1.4 0.2 setosa
3 4.7 3.2 1.3 0.2 setosa
4 4.6 3.1 1.5 0.2 setosa
5 5.0 3.6 1.4 0.2 setosa
6 5.4 3.9 1.7 0.4 setosaStep 2: Splitting the Data into Training and Testing SetsWe’ll split the data into training and testing sets to evaluate the performance of our decision tree model. Step 3: Training a Decision Tree ModelUsing the train function from the caret package, we can train a decision tree model. We’ll use the rpart method for this purpose. Output: CART
120 samples
4 predictor
3 classes: 'setosa', 'versicolor', 'virginica'
No pre-processing
Resampling: Bootstrapped (25 reps)
Summary of sample sizes: 120, 120, 120, 120, 120, 120, ...
Resampling results across tuning parameters:
cp Accuracy Kappa
0.00 0.9398492 0.9086993
0.45 0.7426390 0.6253355
0.50 0.5557896 0.3665192
Accuracy was used to select the optimal model using the largest value.
The final value used for the model was cp = 0.Step 4: Plotting the Decision TreeTo visualize the trained decision tree, we’ll use the rpart.plot function from the rpart.plot package. Output: Make a Tree Plot in Caret Package Step 5: Customizing the Tree PlotThe rpart.plot function offers several customization options to enhance the appearance of the tree plot. Let’s explore some of these options. Output: 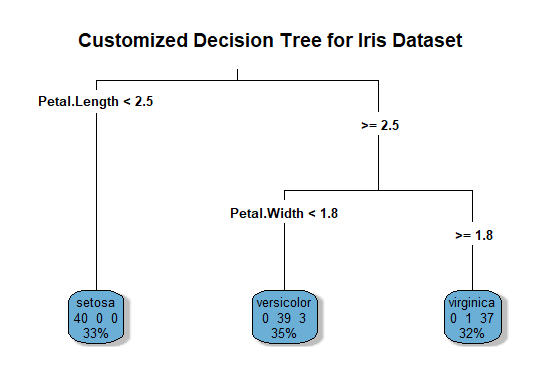 Make a Tree Plot in Caret Package ConclusionCreating and visualizing a decision tree model using the caret package in R is straightforward and highly customizable. By following the steps outlined in this article, you can train a decision tree model, visualize it, and evaluate its performance on a test dataset. The rpart.plot function provides various options to customize the tree plot, making it easier to interpret and present your results. |
Reffered: https://www.geeksforgeeks.org
| AI ML DS |
Type: | Geek |
Category: | Coding |
Sub Category: | Tutorial |
Uploaded by: | Admin |
Views: | 16 |