.jpg)
|
|
The lattice package is the powerful data visualization package in R. It can provide the functions for creating the Trellis graphics which can be particularly useful for visualizing multivariate data. This package in R Programming Language can allow for the creation of conditioned plots that can display the data across multiple panels and provide a comprehensive view of the relationships between the variables. This article will guide you on installing and verifying the lattice installation in Anaconda. Main ConceptThe main concept involves using Anaconda, which is the popular distribution for Python and R. To install and manage the packages. Anaconda can provide a convenient way to manage the environments and dependencies, ensuring that the R packages such as the lattice are installed and work seamlessly. Here we will discuss step by step How to Install R lattice in Anaconda. Step 1: Open the Anaconda PromptWe can open the Anaconda Prompt. This can be found in Start Menu of Windows. Install lattice Package in Anaconda Step 2: Create the New EnvironmentCreate the new environment to manage the dependencies and avoid the conflicts with other packages. We can create the new environment by running the following command. conda create --name exampleEnv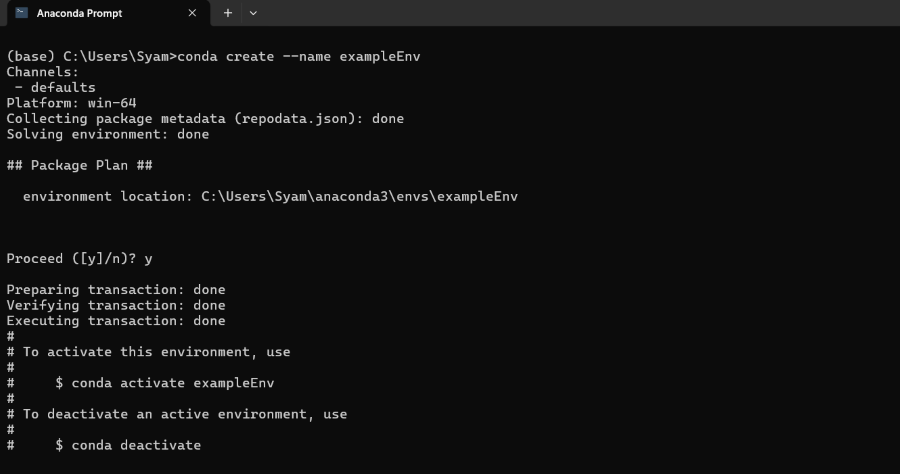 Install lattice Package in Anaconda Once Created, activate the environment. conda activate exampleEnv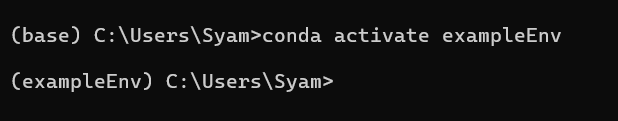 Install lattice Package in Anaconda Step 3: Install the latticeWe can install the lattice package, we need to use the conda package manager with the conda-forge channel which can hosts many R packages. Run the following command: conda install -c conda-forge r-lattice Install lattice Package in Anaconda This command will download and install the lattice package along with the necessary dependencies. Step 4: Verify the InstallationAfter the installation is complete, we can verify it by the starting the R session and loading the lattice library. 1. Start the R session by typing the R in Anaconda Prompt R2. Then, in R session Type library(lattice)Output:  Install lattice Package in Anaconda This example can deomonstrates how to create the basic scatter plot using the lattice package in the R programming. ConclusionThe lattice package in R is the versatile tool for creating the sophisticated data visualizations. By following the steps outlined steps, we can successfully install and verify the lattice package within the Anaconda environment. This allows for the efficient data analysis and visualization, leveraging the strengths of the both Anaconda and R |
Reffered: https://www.geeksforgeeks.org
| R Language |
Type: | Geek |
Category: | Coding |
Sub Category: | Tutorial |
Uploaded by: | Admin |
Views: | 17 |