|
|
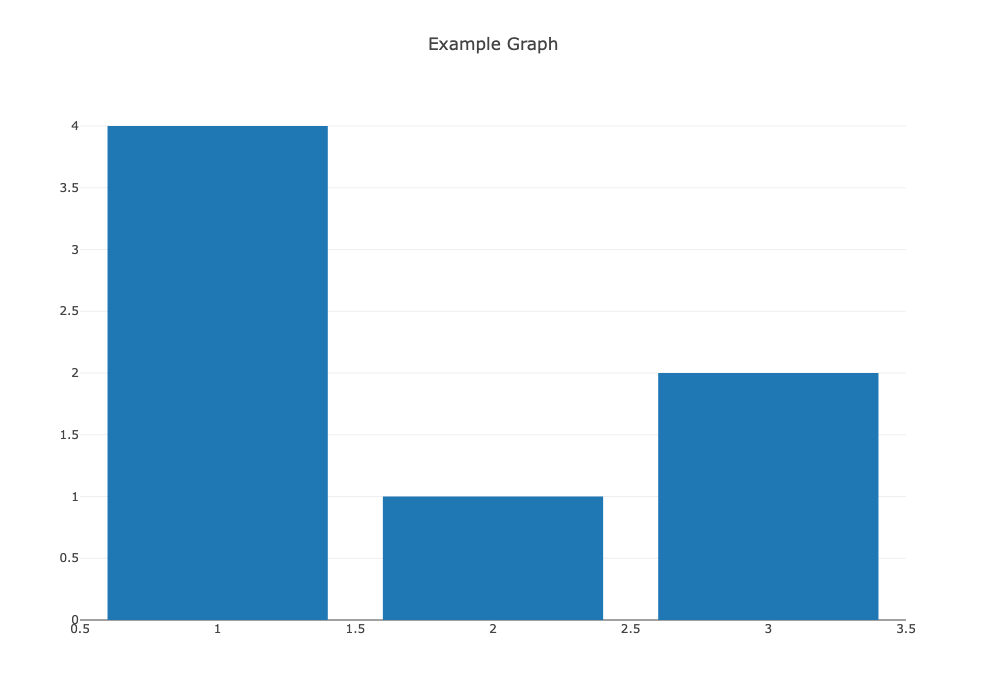
Dash is a popular Python framework for building interactive web applications, particularly for data visualization. Developed by Plotly, Dash allows users to create web-based dashboards with minimal code. One common requirement when working with Dash is adjusting the size of graphs to fit the layout and design needs of the dashboard. What is a Dash Graph?A Dash graph is a data visualization component created using the Plotly library within a Dash application. These graphs can be interactive and customized in various ways, including their size, colors, layout, and interactivity features. Dash graphs are typically used to represent data insights in a clear and visually appealing manner. Make sure you have installed all the required Dash packages correctly. Run the following commands to ensure everything is up to date: pip install dash dash-core-components dash-html-componentsMethods to Change the Window Size of Your Dash GraphExample 1: Using the style AttributeOne of the simplest ways to change the size of a Dash graph is by using the style attribute in the dcc.Graph component. This method allows you to set the width and height of the graph directly. In this example, the style attribute sets the width to 50% of the parent container and the height to 500 pixels. Output: How Can I Change the Size of My Dash Graph? Example 2: Using Plotly LayoutAnother way to change the size of your Dash graph is by adjusting the layout properties in the Plotly figure. The width and height properties of the layout dictionary can be used to set the size of the graph. Here, the width and height properties in the layout dictionary are used to set the size of the graph to 600 by 400 pixels.  How Can I Change the Size of My Dash Graph? – 2 Example 3: Responsive Graph SizingTo create a graph that dynamically adjusts its size based on the window size, you can use CSS and the style attribute together. This approach makes the graph responsive and adaptable to different screen sizes. In this example, the graph will take up 100% of the width and height of the viewport, making it fully responsive to changes in window size. Output: 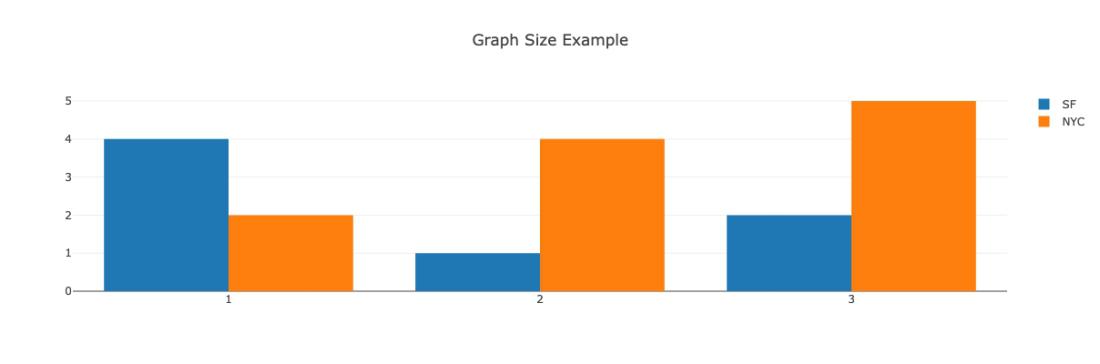 How Can I Change the Size of My Dash Graph? -3 ConclusionChanging the size of your Dash graph is crucial for creating a visually appealing and user-friendly dashboard. Whether you prefer using the style attribute, adjusting the Plotly layout properties, or creating a responsive design with CSS, Dash provides flexible methods to customize the size of your graphs. These examples demonstrate how to effectively resize your graphs to fit the specific needs of your Dash application. |
Reffered: https://www.geeksforgeeks.org
| Python |
Type: | Geek |
Category: | Coding |
Sub Category: | Tutorial |
Uploaded by: | Admin |
Views: | 20 |