
|
|
When creating plots with ggplot2, you may often want to control the size of lines and points independently. This can be particularly useful when you’re working with scatter plots that have connecting lines, or when you want to emphasize certain aspects of your data. In this article, we’ll explore how to scale the size of lines and points separately in ggplot2 in R Programming Language. Separate Scaling for Lines and PointsTo scale the size of lines and points separately, you need to specify the Methods for scaling the size of lines Method 1: Basic Approach Using Size AestheticsLet’s start with a basic example where we set different sizes for points and lines: Ouptut: Scale the size of line and point separately in ggplot2 In this example, we set the line size to 1 and the point size to 3. The size parameter in geom_line() controls the thickness of the line, while in geom_point() it controls the diameter of the points. Method 2: Scaling Sizes Based on Data ValuesOften, you may want to scale the size of points or lines based on a variable in your data: Output:  Scale the size of line and point separately in ggplot2 Here, we’re scaling the line size based on the ‘weight’ variable, while keeping the point size constant. The scale_size_continuous() function allows us to control the range of line thicknesses. Method 3: Scale the size Using Different Aesthetics for Lines and PointsTo have more control, we can use different aesthetics for lines and points: Output:  Scale the size of line and point separately in ggplot2 In this example, we’re using ‘weight’ to scale line thickness and ‘y’ to scale point size. Note the use of scale_size_area() for points, which scales the area of the points rather than their diameter. Method 4: Using Secondary Axis for Independent ScalingFor even more control, we can use a secondary axis: Output:  Scale the size of line and point separately in ggplot2 This approach allows us to have separate legends for line and point sizes. Method 5: Using manual ScalingFor complete control, you can use manual scaling: Output: 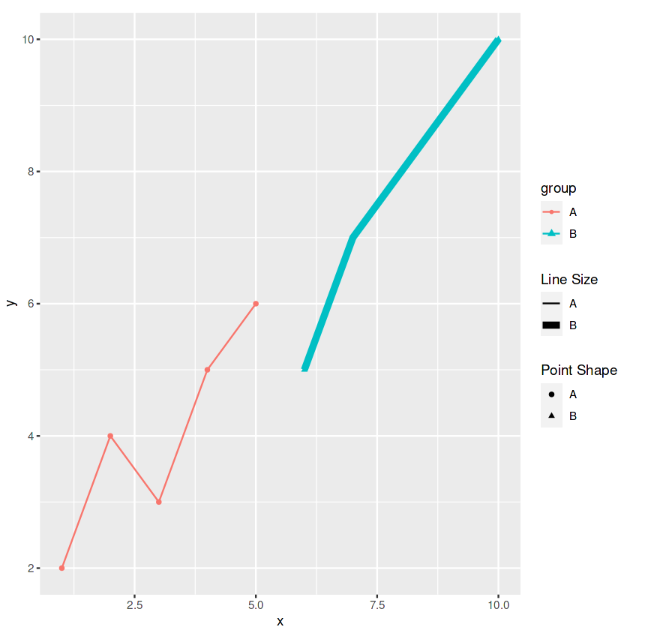 Scale the size of line and point separately in ggplot2 This method allows you to set exact sizes for each group or category. ConclusionScaling the size of lines and points independently in ggplot2 offers great flexibility in data visualization. By using different aesthetics, scale functions, and even secondary axes, you can create plots that emphasize different aspects of your data through size variations. Remember to consider the readability and interpretability of your plot when adjusting sizes, and always aim for clear communication of your data. |
Reffered: https://www.geeksforgeeks.org
| R Language |
Type: | Geek |
Category: | Coding |
Sub Category: | Tutorial |
Uploaded by: | Admin |
Views: | 22 |