|
Regression analysis is a fundamental technique in data science and machine learning, used to model the relationship between a dependent variable and one or more independent variables. Among the various types of regression, nonlinear regression and polynomial regression are two important approaches for modeling complex relationships.
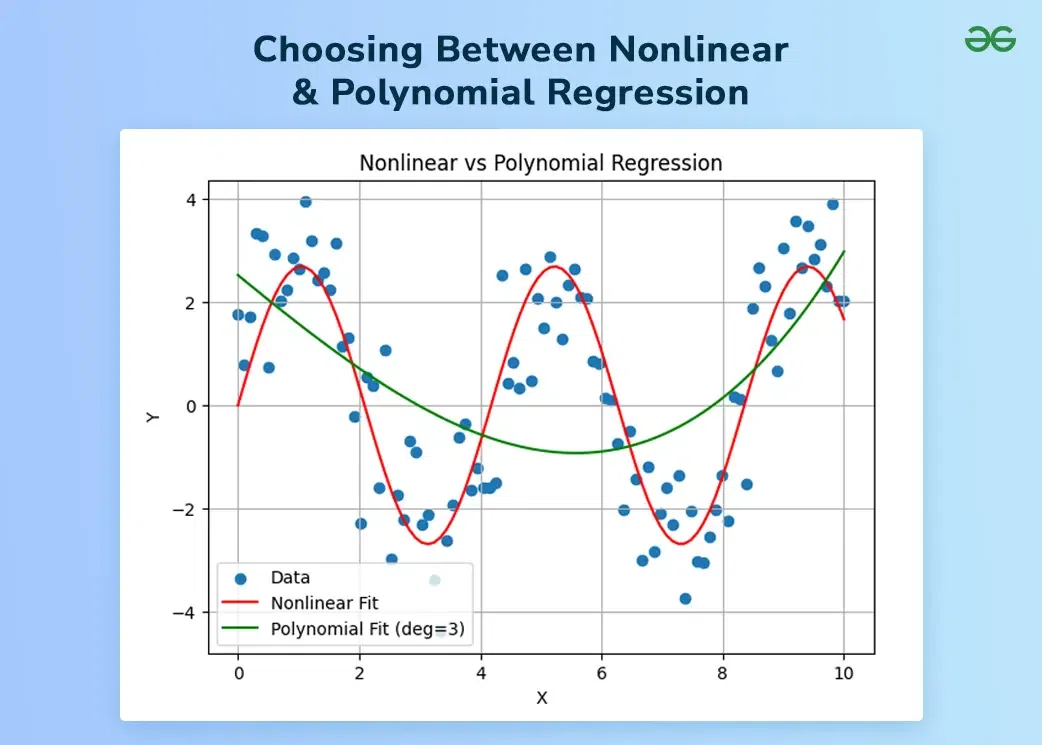 Choosing Between Nonlinear and Polynomial Regression This article delves into the differences between these two methods, their applications, advantages, and limitations.
Understanding Nonlinear RegressionNonlinear regression is a form of regression analysis in which the relationship between the independent variable(s) and the dependent variable is modeled as a nonlinear function. Unlike linear regression, which assumes a straight-line relationship, nonlinear regression can model more complex, curved relationships.
Characteristics of Nonlinear Regression:
- Model Flexibility: Nonlinear regression can model a wide variety of relationships, including exponential, logarithmic, and power-law relationships.
- Complexity: The models can become quite complex, involving multiple parameters and intricate functional forms.
- Estimation Methods: Nonlinear regression often requires iterative methods for parameter estimation, such as the Gauss-Newton algorithm or the Levenberg-Marquardt algorithm.
Consider a scenario where the growth rate of a bacterial culture is modeled by an exponential function:
[Tex]y=a⋅e
bx[/Tex]
where y is the bacterial count, x is time, and a and b are parameters to be estimated.
Understanding Polynomial RegressionPolynomial regression is a specific type of regression analysis where the relationship between the independent variable x and the dependent variable y is modeled as an n-th degree polynomial. Despite fitting a nonlinear relationship, polynomial regression is considered a special case of linear regression because it is linear in terms of the unknown parameters.
Characteristics of Polynomial Regression:
- Model Flexibility: Polynomial regression can model curved relationships by including higher-degree terms of the independent variable.
- Complexity: The complexity increases with the degree of the polynomial, potentially leading to overfitting.
- Estimation Methods: Polynomial regression uses the least squares method for parameter estimation, similar to linear regression.
A quadratic polynomial regression model can be represented as:
[Tex]y=a_0+a_1x+a_2x^2[/Tex]
where y is the dependent variable, x is the independent variable, and a0, a1, and a2 are coefficients to be estimated.
Key Differences Between Nonlinear and Polynomial Regression1. Nature of Relationship- Nonlinear Regression: Models a wide range of nonlinear relationships, including exponential, logarithmic, and power-law functions.
- Polynomial Regression: Specifically models relationships as polynomials, which are a subset of nonlinear functions.
2. Model Complexity- Nonlinear Regression: Can involve complex functional forms and multiple parameters, making the models more intricate.
- Polynomial Regression: Complexity is determined by the degree of the polynomial. Higher-degree polynomials can model more complex relationships but may lead to overfitting.
3. Estimation Methods- Nonlinear Regression: Often requires iterative methods for parameter estimation, which can be computationally intensive.
- Polynomial Regression: Uses the least squares method, which is computationally simpler and more straightforward.
4. Flexibility and Overfitting- Nonlinear Regression: Offers greater flexibility in modeling various types of relationships but can be prone to overfitting if the model is too complex.
- Polynomial Regression: Provides flexibility through higher-degree terms but is also susceptible to overfitting, especially with high-degree polynomials.
Practical Applications for Nonlinear regression and Polynomial regressionNonlinear Regression:
- Biological Growth Models: Modeling the growth of populations, such as bacterial cultures or tumor growth, which often follow exponential or logistic patterns.
- Chemical Kinetics: Describing the rate of chemical reactions, which may follow complex nonlinear relationships.
- Economics: Modeling utility functions, demand curves, and other economic relationships that are not linear.
Polynomial Regression:
- Agricultural Yield Prediction: Predicting crop yields based on environmental factors like temperature and rainfall, where the relationship is often nonlinear.
- Electricity Consumption: Modeling electricity usage based on temperature, where consumption patterns may follow a U-shaped curve.
- Physics: Describing motion under uniform acceleration, where the distance traveled is a quadratic function of time.
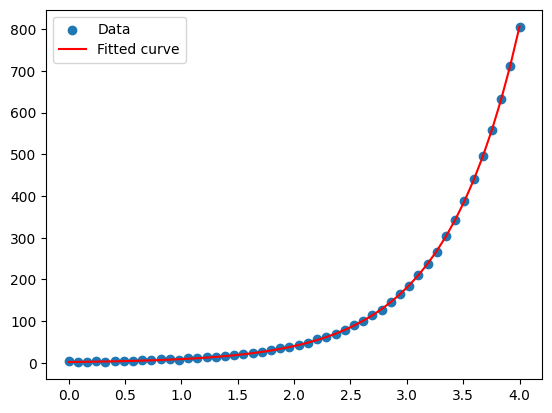
Implementing Nonlinear and Polynomial Regression in PythonNonlinear Regression Example
Python
import numpy as np
import matplotlib.pyplot as plt
from scipy.optimize import curve_fit

# Define the nonlinear function
def exponential_growth(x, a, b):
    return a * np.exp(b * x)
x_data = np.linspace(0, 4, 50)
y_data = exponential_growth(x_data, 2, 1.5) + np.random.normal(size=x_data.size)
params, covariance = curve_fit(exponential_growth, x_data, y_data)
plt.scatter(x_data, y_data, label='Data')
plt.plot(x_data, exponential_growth(x_data, *params), label='Fitted curve', color='red')
plt.legend()
plt.show()
Output:
 Nonlinear Regression Polynomial Regression Example
Python
import numpy as np
import matplotlib.pyplot as plt
from sklearn.linear_model import LinearRegression
from sklearn.preprocessing import PolynomialFeatures

x = np.linspace(-3, 3, 100).reshape(-1, 1)
y = 2 + 3 * x + 4 * x**2 + np.random.normal(size=x.size).reshape(-1, 1)

# Transform the data to include polynomial features
poly = PolynomialFeatures(degree=2)
x_poly = poly.fit_transform(x)
model = LinearRegression()
model.fit(x_poly, y)
y_pred = model.predict(x_poly)
plt.scatter(x, y, label='Data')
plt.plot(x, y_pred, label='Fitted curve', color='red')
plt.legend()
plt.show()
Output:
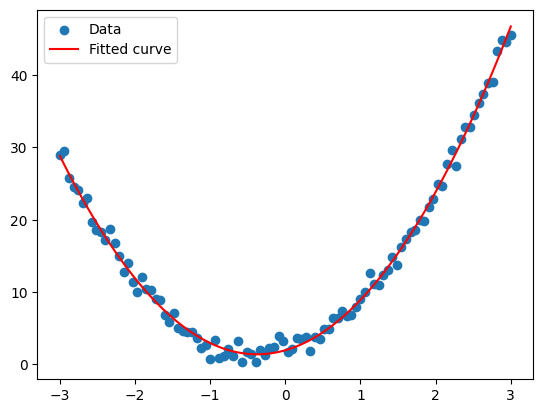 Polynomial Regression Example Advantages and Limitations of Nonlinear Regression and Polynomial Regression Nonlinear Regression
| Advantages | Limitations |
|---|
| Can fit any nonlinear model. | Can be computationally intensive. |
|---|
| Provides a more accurate representation of nonlinear relationships. | May require a large amount of data to estimate the parameters accurately. |
|---|
Polynomial Regression
| Advantages | Limitations |
|---|
| Offers greater flexibility than linear regression. | More prone to overfitting, especially when the degree of the polynomial is high. |
|---|
| Can capture complex patterns and curves in the data. | Can be computationally intensive. |
|---|
Key Considerations: Choosing the Right Regression ModelWhile both nonlinear regression and polynomial regression address the limitations of linear regression, selecting the appropriate technique hinges on several crucial factors:
- Data Characteristics: The inherent nature of the data dictates the choice of method. If the underlying relationship exhibits a clear exponential or logarithmic pattern, a specific nonlinear function tailored to that pattern might be more efficient. On the other hand, if the data suggests a more generic, undefined curve, polynomial regression becomes a viable option.
- Interpretability: Linear models, including polynomial regression with lower degrees, offer a clear interpretation of the coefficients. However, interpreting the parameters of complex nonlinear functions can be challenging. This necessitates careful consideration of the trade-off between flexibility and interpretability.
- Computational Complexity: Fitting a nonlinear model often requires iterative optimization algorithms, which can be computationally expensive compared to the linear regression techniques employed in polynomial regression.
ConclusionNonlinear regression and polynomial regression are powerful tools for modeling complex relationships between variables. While nonlinear regression offers greater flexibility and can model a wide range of functional forms, it is computationally intensive and can be difficult to interpret. Polynomial regression, on the other hand, is simpler to implement and can effectively model curved relationships, but it is limited to polynomial forms and can suffer from overfitting with high-degree polynomials.
Choosing between these methods depends on the nature of the data and the specific requirements of the analysis. By understanding the strengths and limitations of each approach, data scientists and analysts can select the most appropriate method for their regression tasks, leading to more accurate models and better insights.
|