|
The %matplotlib inline magic command is an essential tool used in Jupyter Notebooks, primarily for visualizing plots and figures inline within the notebook. This command belongs to the broader category of IPython magic commands, which provide a way to control the behavior of IPython itself and to perform a variety of system tasks.
Understanding %matplotlib inlineIn Jupyter Notebooks, %matplotlib inline is a magic command that allows matplotlib plots to appear inline within the notebook. This implies that rather than opening in another window, when you do not run any code cell you will get your plot below the code cell.
Inline Plots in Jupyter NotebooksJupyter Notebooks are an interactive environment where you can combine code execution, text, and visualizations. One of the key features that make Jupyter Notebooks so powerful is their ability to display visual outputs directly within the notebook cells. This is where %matplotlib inline comes into play.
Purpose of %matplotlib inlineThe primary purpose of %matplotlib inline is to enable the display of Matplotlib plots directly within the Jupyter Notebook cells, as opposed to opening them in a separate window. Here are the main benefits and purposes of using %matplotlib inline:
1. Inline Display of PlotsBy default, Matplotlib plots are displayed in a separate window. Using %matplotlib inline, you can ensure that all plots created in a Jupyter Notebook are embedded within the notebook itself. This makes it easier to visualize and interact with plots in the context of your code and analysis.
Python
%matplotlib inline
import matplotlib.pyplot as plt
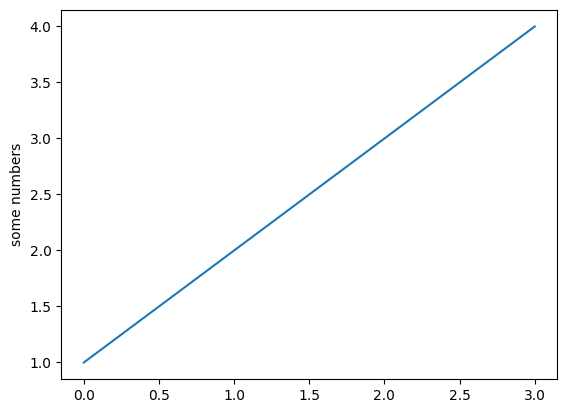
plt.plot([1, 2, 3, 4])
plt.ylabel('some numbers')
plt.show()
In this example, the plot will appear directly below the code cell, making it easy to interpret and analyze.
Output:
 Inline Display of Plots 2. Improved Workflow and DocumentationHaving plots inline with the code enhances the readability and documentation of your analysis. It allows you to create comprehensive notebooks where code, text, and visualizations are seamlessly integrated. This is particularly useful for sharing your work with others or for future reference.
3. Simplified Debugging and IterationWhen working on data analysis or visualization tasks, being able to see the plots immediately after running the code helps in debugging and refining your visualizations. You can quickly iterate on your plots, making adjustments and seeing the results in real time without switching between windows.
4. Consistency Across Different EnvironmentsUsing %matplotlib inline ensures that your plots will be displayed inline across different environments where Jupyter Notebooks are supported. This includes local Jupyter installations, JupyterHub, and cloud-based notebook services like Google Colab and Azure Notebooks.
Alternatives to %matplotlib inlineWhile %matplotlib inline is the most commonly used magic command for inline plotting, there are other alternatives depending on your specific needs:
- %matplotlib notebook: This command enables interactive plots within the notebook. It allows you to zoom, pan, and resize plots, providing a more dynamic and interactive experience.
- %matplotlib qt: This command directs Matplotlib to display plots in a separate Qt window. This can be useful for more advanced interactive visualizations.
Simple Example of Using %matplotlib inlineHere’s a simple example to illustrate the use of %matplotlib inline:
Python
# Import the necessary libraries
import matplotlib.pyplot as plt
import numpy as np

# Use the magic command
%matplotlib inline

# Generate some data
x = np.linspace(0, 10, 100)
y = np.sin(x)

# Create a plot
plt.plot(x, y)
plt.title("Sine Wave")
plt.xlabel("X values")
plt.ylabel("Sine of X")
plt.show()
Output:
 Simple Example of Using %matplotlib inline In this example:
%matplotlib inline ensures that the plot of the sine wave appears directly in the notebook, right after the code cell.
The plt.show() command is technically not necessary when %matplotlib inline is used, but it can still be included for clarity.
Benefits of %matplotlib inline- Enhanced Readability and Documentation: Embedding plots within the notebook cells improves the readability of your notebook. Code, narrative text, and visualizations are seamlessly integrated, creating a comprehensive and easily interpretable document. This is particularly useful for sharing your work with colleagues or for future reference.
- Streamlined Workflow: By displaying plots inline,
%matplotlib inline simplifies the workflow. There is no need to switch between windows to view your plots, which makes the process of creating and refining visualizations more efficient. This is especially valuable when iterating on data visualizations, as you can see the results of your changes immediately. - Improved Debugging: Inline plotting aids in debugging by providing immediate visual feedback. When working on data analysis or visualization tasks, being able to see the plots directly in the notebook helps you identify and correct errors quickly. This real-time feedback loop accelerates the development process.
- Consistent Visualization Across Platforms: Using
%matplotlib inline ensures that your visualizations are consistent across different platforms and environments. Whether you are using a local Jupyter Notebook installation, JupyterHub, or cloud-based services like Google Colab, your plots will be displayed inline, providing a uniform experience. - Integration with Other Tools: Inline plotting integrates well with other Jupyter Notebook features and extensions. For example, you can use interactive widgets alongside your plots, creating dynamic visualizations that respond to user input. This opens up a wide range of possibilities for interactive data exploration and presentation.
ConclusionThe %matplotlib inline magic command is a powerful tool for embedding Matplotlib plots directly within Jupyter Notebooks. It enhances the interactivity, readability, and workflow of your data analysis and visualization tasks. By using this command, you can create comprehensive and well-documented notebooks that seamlessly integrate code, text, and visualizations. Whether you are a data scientist, researcher, or educator, %matplotlib inline is an essential component of your Jupyter Notebook toolkit.
|