|
|
Polynomial contrasts are a useful technique in regression analysis for modeling non-linear relationships between a predictor variable and the response variable. This approach allows you to fit polynomial curves (such as quadratic, cubic, etc.) to the data. This article will guide you through the theory behind polynomial contrasts and provide practical examples using R Programming Language. Introduction to Polynomial ContrastsPolynomial contrasts transform a categorical variable into a set of orthogonal polynomial terms, which can be used in regression models to detect trends and non-linear patterns in the data. These contrasts are particularly useful when you have ordinal data or when you suspect that the relationship between the predictor and the response is non-linear.
Polynomial RegressionPolynomial regression is a form of regression analysis where the relationship between the independent variable x and the dependent variable y is modeled as an n-degree polynomial. Implementing Polynomial Contrasts in RNow we will discuss the Implementing Polynomial Contrasts in R Programming language. Step 1: Load Necessary PackagesTo begin, load the necessary R packages. For polynomial contrasts, you primarily need the stats package, which is included in base R. Step 2: Generate Example DatasetCreate a synthetic dataset with an independent variable and a dependent variable that follows a non-linear relationship. Output: x y Step 3: Fit Polynomial Regression ModelUse the lm() function to fit a polynomial regression model. You can use the poly() function to specify polynomial terms. Output: Call: The output of the summary(fit) function provides coefficients for each polynomial term, along with their statistical significance:
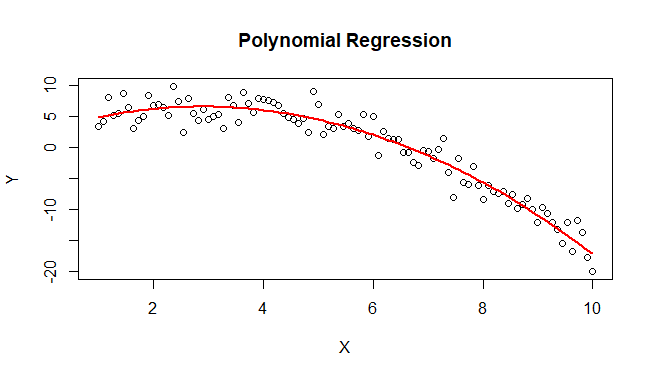
Step 4: Visualize the FitPlot the original data and the fitted polynomial curve to visualize the fit. Output: Polynomial Contrasts for Regression Using R The plot shows the original data points and the fitted polynomial curve, which helps in visualizing how well the model captures the underlying trend in the data. ConclusionPolynomial contrasts are a powerful tool for modeling non-linear relationships in regression analysis. In R, the lm() function combined with the poly() function makes it easy to implement polynomial regression models. By fitting polynomial models and visualizing the results, you can uncover complex patterns and trends in your data that might not be apparent with linear models. This approach is especially useful when dealing with ordinal data or when there is a known non-linear relationship between the predictors and the response variable. |
Reffered: https://www.geeksforgeeks.org
| AI ML DS |
Type: | Geek |
Category: | Coding |
Sub Category: | Tutorial |
Uploaded by: | Admin |
Views: | 17 |