|
Spectrum analysis is a powerful technique used in signal processing to analyze the frequency content of signals. It finds applications in various fields such as telecommunications, audio processing, and vibration analysis. In this article, we’ll explore the fundamentals of spectrum analysis and how it can be implemented in Python.
What is Spectrum Analysis?Spectrum analysis is the process of decomposing a signal into its frequency components and revealing the amplitude of each frequency component present in it.
By analyzing the frequency spectrum, It can identify the patterns, anomalies, and other characteristics of the signal present in a signal and their magnitudes. Spectrum analysis can be performed in both the time domain and the frequency domain. Spectrum analysis is essential in various fields such as telecommunications, audio processing, and vibration analysis for understanding and interpreting signals in the frequency domain.
Types of Spectrum AnalysisBroadly Spectrum Analysis can be divided into two parts.
- Continuous Spectrum Analysis:
Analyzes continuous-time signals using techniques like Fourier transform. - Discrete Spectrum Analysis:
Analyzes discrete-time signals using techniques like discrete Fourier transform (DFT) and its fast implementation, the fast Fourier transform (FFT).
Principles of Spectrum AnalysisThe core principle of spectrum analysis is based on the understanding that any complex, time-varying signal can be represented as a sum of simple sinusoidal waves (sine and cosine functions) of various frequencies, amplitudes, and phases. This representation is made possible through the use of mathematical transformations that convert time-domain signals (signals represented as variations over time) into frequency-domain signals (signals represented as variations over frequency).
This transformation is crucial for analyzing signals whose characteristics are more readily understood in the frequency domain.
For example, identifying the dominant frequencies in a piece of music or detecting the frequency of a periodic signal corrupted by noise.
How to do Spectrum Analysis?Let’s delve into Python code examples that demonstrate the implementation of each spectrum analysis method. These examples will help clarify how each method is applied and its significance.
- The Fourier transform is a mathematical tool used to decompose a signal into its constituent frequencies.
- In Python, the Fourier transform can be computed using libraries like NumPy.
- The resulting spectrum represents the frequency content of the signal.
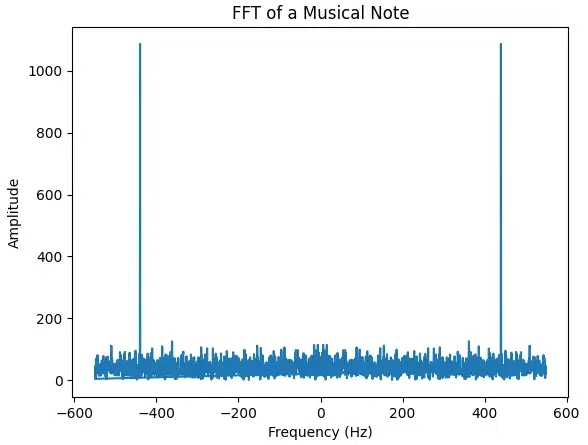
Analyzing the frequencies present in a musical note:
The below code generates a musical note signal with added noise, then applies Fast Fourier Transform (FFT) to analyze its frequency spectrum. The resulting plot displays the amplitude of frequency components present in the signal. Peaks in the plot represent dominant frequencies, indicating the note’s fundamental frequency and harmonics. The noise introduces additional frequency components, visible as smaller peaks or fluctuations in the plot.
Python
import numpy as np
import matplotlib.pyplot as plt

# Generating a sample musical note signal
fs = 1100  # Sampling frequency (Hz)
duration = 2  # seconds
frequency = 440  # A4 note frequency (Hz)
t = np.linspace(0, duration, int(fs * duration), endpoint=False)
signal = np.sin(2 * np.pi * frequency * t) + np.random.normal(0, 1, len(t))  # Signal with noise

# Applying FFT
fft_result = np.fft.fft(signal)
freq = np.fft.fftfreq(t.shape[-1], d=1/fs)

# Plotting the spectrum
plt.plot(freq, np.abs(fft_result))
plt.title('FFT of a Musical Note')
plt.xlabel('Frequency (Hz)')
plt.ylabel('Amplitude')
plt.show()
Output:
Significance of Fast Fourier Transform (FFT) in Spectrum Analysis:
FFT enables the efficient analysis of frequency components in signals, crucial for applications in music, communications, and more. The graph clearly indicates the presence of a dominant frequency, which corresponds to the musical note being played.
2. Power Spectral Density (PSD)- Power Spectral Density (PSD) is a measure of the power distribution of a signal over its frequency components.
- It provides information about the strength of different frequency components in the signal.
- PSD estimation can be performed using techniques like periodogram and Welch’s method.
Significance of Power Spectral Density (PSD) in Spectrum Analysis:
Power Spectral Density (PSD) is vital in spectrum analysis, offering insights into a signal’s frequency distribution and power levels. It aids in characterizing dominant frequency components, designing signal processing algorithms, and evaluating system performance. Additionally, PSD analysis helps distinguish between signal and noise components, facilitates noise reduction, and enables spectral estimation techniques for random signals. Overall, PSD plays a crucial role in understanding signal spectra and optimizing signal processing systems.
A. Periodogram- A periodogram is a plot of the squared magnitude of the signal’s Fourier transform.
- It offers a visual representation of the signal’s frequency content.
- Periodograms can suffer from high variance, particularly for short or non-stationary signals.
Analyzing Power Spectral Density of Bird Chirp Signals using Periodogram.
- Signal Generation: A synthetic signal resembling a bird chirp is generated with a frequency that increases over time, mimicking the characteristic chirping pattern.
- Periodogram Calculation: The periodogram function from scipy.signal is utilized to compute the Power Spectral Density (PSD) of the generated signal.
- Plotting: The resulting PSD, along with corresponding frequencies, is plotted on a semilogarithmic scale to visualize the spectral characteristics of the bird chirp signal.
Python3
from scipy.signal import periodogram

# Generating a sample signal (bird chirp)
duration = 2  # seconds
fs = 8000  # Sampling frequency (Hz)
t = np.linspace(0, duration, int(fs * duration), endpoint=False)
signal = np.sin(2 * np.pi * 1000 * np.sqrt(t))  # Frequency increases over time

# Calculating the periodogram
frequencies, powers = periodogram(signal, fs)

# Plotting the periodogram
plt.semilogy(frequencies, powers)
plt.title('Periodogram of a Bird Chirp')
plt.xlabel('Frequency (Hz)')
plt.ylabel('PSD')
plt.show()
Output:

Significance of Periodogram in Power Spectral Density Analysis of Spectrum:
Periodogram serves as a fundamental tool in power spectral density (PSD) analysis, providing insights into frequency distribution within a signal. By transforming time-domain signals into frequency-domain representations, it enables identification of dominant frequencies and their power levels. This analysis helps in the fields like signal processing, communication, and vibration analysis, facilitating the understanding of underlying frequency components and their contributions to the overall signal characteristics.
B. Welch Method for Power Spectral Density- Welch Method estimates PSD by averaging periodograms of overlapping signal segments.
- It helps reduce variance and improve reliability, especially for non-stationary signals.
- The Welch Method divides the signal into segments, applies a window function, and computes the FFT for each segment.
Implementing Welch’s Method for Power Spectral Density Analysis
- Import libraries: Load the necessary libraries like Numpy, Matplotlib, and Scipy.
- Synthetic Signal Genrations: A synthetic signal is generated for demonstration purposes, composed of two sine waves (50 Hz and 120 Hz) combined with random Gaussian noise. This setup simulates a typical real-world signal where you might want to identify underlying frequencies despite the presence of noise.
- Applying Welch’s Method: The welch function from the scipy.signal module is used to estimate the PSD of the noisy signal. The fs parameter specifies the signal’s sampling frequency, and nperseg defines the length of each segment for which the periodogram is calculated. Shorter segments can lead to a smoother PSD estimate but may also decrease frequency resolution.
- Plotting the PSD: The resulting PSD is plotted on a semilogarithmic scale, which helps in visualizing a wide range of power values. This plot displays the PSD against frequency, highlighting the presence of significant power at the frequencies of the original sine waves, despite the noise in the signal.
Python3
import numpy as np
import matplotlib.pyplot as plt
from scipy.signal import welch

# Generate a noisy signal for demonstration
np.random.seed(42)  # Ensure reproducibility
fs = 500  # Sampling frequency in Hz
t = np.arange(0, 10, 1/fs)  # Time vector from 0 to 10 seconds
# Create a signal with two sine waves and random noise
signal = np.sin(2*np.pi*50*t) + 0.5*np.sin(2*np.pi*120*t) + np.random.normal(0, 2, t.shape)

# Apply Welch's method to estimate the PSD
frequencies, psd_values = welch(signal, fs, nperseg=1024)

# Plotting the estimated PSD
plt.semilogy(frequencies, psd_values)
plt.title('Power Spectral Density (PSD) Estimate using Welch\'s Method')
plt.xlabel('Frequency (Hz)')
plt.ylabel('PSD (V^2/Hz)')
plt.tight_layout()
plt.show()
Output:
.png) Output3 Significance of Welch method in Power Spectral Density Analysis of Spectrum:
The Welch method is significant in Power Spectral Density (PSD) analysis for its ability to provide accurate spectral estimation, especially in scenarios with limited data or non-stationary signals. By dividing the signal into overlapping segments and averaging their periodograms, the Welch method reduces variance and improves frequency resolution compared to traditional methods like the periodogram. This makes it valuable for analyzing signals in real-world applications such as communications, audio processing, and vibration analysis.
Each method offers unique insights and has specific applications based on the characteristics of the signal being analyzed and the requirements of the analysis.
Applications of Spectrum Analysis- Signal Characterization: Spectrum analysis helps in understanding the frequency components of a signal. By analyzing the spectrum, we can determine the frequency distribution, amplitude, and phase of the signal. This information is crucial for understanding the characteristics and behavior of the signal.
- Noise Detection and Reduction: Spectrum analysis is used to identify and analyze noise components present in a signal. By examining the spectrum, engineers can distinguish between the signal and noise components and take appropriate measures to reduce or eliminate unwanted noise, thus improving the signal quality.
- Frequency Allocation: In telecommunications, spectrum analysis is vital for efficient frequency allocation. By analyzing the spectrum usage in a given region, regulatory bodies can allocate frequencies to different services (such as radio, TV, mobile communication) without causing interference between them, ensuring smooth communication and optimal use of the available spectrum.
- Fault Diagnosis: Spectrum analysis is an invaluable tool for diagnosing faults or abnormalities in electronic systems. By analyzing the spectrum of a faulty signal or system, engineers can pinpoint the source of the problem, whether it’s due to interference, distortion, or malfunctioning components. This helps in troubleshooting and resolving issues effectively.
- Research and Development: Spectrum analysis plays a crucial role in research and development across various disciplines. Scientists and engineers use spectrum analysis to study the behavior of signals in different environments, develop new communication technologies, design efficient filters and modulation techniques, and explore the properties of materials and substances through techniques like spectroscopy.
Overall, spectrum analysis provides valuable insights into the characteristics of signals, facilitates efficient use of the frequency spectrum, aids in troubleshooting and fault diagnosis, and drives innovation and advancements in various fields.
ConclusionEach of these methods provides a unique way to analyze the spectrum of signals, with their applicability depending on the nature of the signal and the specific requirements of the analysis. The FFT is widely used for its computational efficiency, PSD for understanding power distribution, the Welch method for its variance reduction in noisy signals, and the periodogram for simple frequency content analysis of short signals. Understanding the output graph in each method is crucial for interpreting the frequency characteristics of the signal being analyzed, facilitating decisions in signal processing applications, design, and analysis.
|