
|
|
In the field of data science, statistics serves as the backbone, providing the essential tools and techniques for extracting meaningful insights from data. Understanding statistics is imperative for any data scientist, as it equips them with the necessary skills to make informed decisions, derive accurate predictions, and uncover hidden patterns within vast datasets. This article explains the significance of statistics in data science, exploring its fundamental concepts and real-life applications.
Table of Content
What are Statistics?Statistics is a branch of mathematics that is responsible for collecting, analyzing, interpreting, and presenting numerical data. It encompasses a wide array of methods and techniques used to summarize and make sense of complex datasets. Key concepts in statistics include descriptive statistics, which involve summarizing and presenting data in a meaningful way, and inferential statistics, which allow us to make predictions or inferences about a population based on a sample of data. Probability theory, hypothesis testing, regression analysis, and Bayesian methods are among the many branches of statistics that find applications in data science. Types of StatisticsThere are commonly two types of statistics, which are discussed below:
Descriptive StatisticsMeasure of Central Tendency
Each of these measures offers distinct perspectives on the central tendency of a dataset. The mean is influenced by extreme values (outliers), whereas the median is more resilient when outliers are present. The mode is valuable for pinpointing the most frequently occurring value(s) in a dataset. Measure of Dispersion
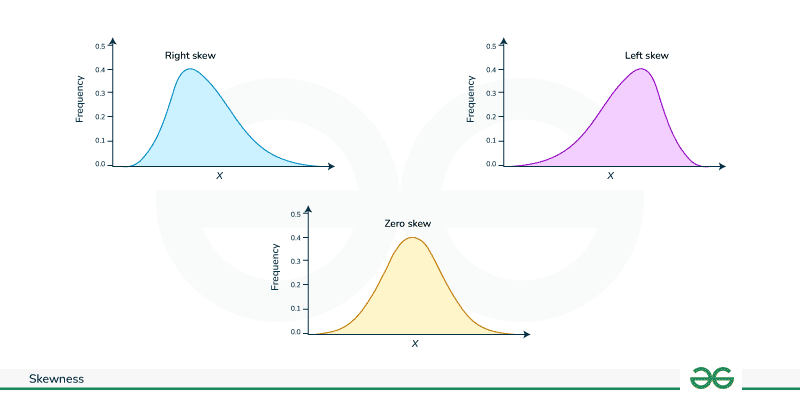
Measure of ShapeKurtosisKurtosis is a statistical measure that describes the shape of a distribution’s tails in relation to its overall shape. It indicates whether data points are more or less concentrated in the tails compared to a normal distribution. High kurtosis signifies heavy tails and possibly outliers, while low kurtosis indicates light tails and a lack of outliers.  Types of Kurtosis SkewnessSkewness is the measure of asymmetry of probability distribution about its mean. Skewness is a statistical measure that describes the asymmetry of a distribution around its mean. A distribution can be:
Types of Skewness Right Skew:
Left Skew:
Zero Skew:
 Types of Skewed data Covariance and Correlation
Regression coefficientRegression coefficient is a value that represents the relationship between a predictor variable and the response variable in a regression model. It quantifies the change in the response variable for a one-unit change in the predictor variable, holding all other predictors constant. In a simple linear regression model, the regression coefficient indicates the slope of the line that best fits the data. In multiple regression, each coefficient represents the impact of one predictor variable while accounting for the effects of other variables in the model. The equation is [Tex]y=\alpha+ \beta * x [/Tex], where
ProbabilityProbability Functions
Bayes TheoremBayes’ Theorem is a fundamental principle in probability theory and statistics that describes how to update the probability of a hypothesis based on new evidence. The formula is as follows: P(A∣B)=P(B)P(B∣A)⋅P(A), where
Probability DistributionsDiscrete Distribution
Continuous DistributionNormal or Gaussian DistributionThe normal distribution also known as the Gaussian distribution, is a continuous probability distribution that is symmetrical and bell-shaped. It is characterized by its mean (μ) and standard deviation (σ). Formula: [Tex]f(X|\mu,\sigma)=\frac{\epsilon^{-0.5(\frac{X-\mu}{\sigma})^2}}{\sigma\sqrt(2\pi)} [/Tex] There is a empirical rule in normal distribution, which states that:
These rule is used to detect outliers.
Hypothesis TestingHypothesis testing makes inferences about a population parameter based on sample statistic.
Null Hypothesis (H₀) and Alternative Hypothesis (H₁)
Level of SignificanceThe level of significance, often denoted by the symbol ([Tex]\alpha [/Tex]), is a critical parameter in hypothesis testing and statistical significance testing. It defines the probability of making a Type I error, which occurs when a true null hypothesis is incorrectly rejected. Type I Error and Type II ErrorIt is also known as Alpha([Tex]\alpha [/Tex]) or significance level. It incorrectly rejects a true null hypothesis i.e. the given statement True but trial says it is false which is wrong output. It is also known as Beta( [Tex]1-\alpha [/Tex]) where we are failing to reject a false null hypothesis i.e. the given statement is false but trial says it is true which is basically wrong output again. Degrees of freedomDegrees of freedom (df) in statistics represent the number of values or quantities in the final calculation of a statistic that are free to vary. It is mainly defined as sample size – one(n-1). Confidence IntervalsA confidence interval is a range of values that is used to estimate the true value of a population parameter with a certain level of confidence. It provides a measure of the uncertainty or margin of error associated with a sample statistic, such as the sample mean or proportion. p-valueThe p-value, short for probability value, is a fundamental concept in statistics that quantifies the evidence against a null hypothesis. Example of Hypothesis testing: Let us consider An e-commerce company wants to assess whether a recent website redesign has a significant impact on the average time users spend on their website. The company collects the following data:
The Hypothesis are defined as: Null Hypothesis (H0): The website redesign has no impact on the average user session duration [Tex]\mu_{after} -\mu_{before} = 0 [/Tex] Alternative Hypothesis (Ha): The website redesign has a positive impact on the average user session duration [Tex]\mu_{after} -\mu_{before} > 0 [/Tex] Significance Level:Choose a significance level, α=0.05(commonly used) Test Statistic and P-Value:
Result:If the p-value is less than the chosen significance level, reject the null hypothesis. If the p-value is greater than or equal to the significance level, fail to reject the null hypothesis. Conclusion:Based on the analysis, the company draws conclusions about whether the website redesign has a statistically significant impact on user session duration. Parametric TestParametric test are statistical methods that make assumption that the data follows normal distribution. Z-testZ-test is used to determine the significant difference between sample mean and known population mean or between two independent samples. Useful when the sample size is large, and population standard deviation is known.
[Tex]Z = \frac{\overline{X}-\mu}{\frac{\sigma}{\sqrt{n}}} [/Tex]
[Tex]Z = \frac{\overline{X_1} -\overline{X_2}}{\sqrt{\frac{\sigma_{1}^{2}}{n_1} + \frac{\sigma_{2}^{2}}{n_2}}} [/Tex] T-testT-test determine if there is a significant difference between the means
[Tex]t = \frac{\overline{X}- \mu}{\frac{s}{\sqrt{n}}} [/Tex]
[Tex]t= \frac{\overline{X_1} – \overline{X_2}}{\sqrt{\frac{s_{1}^{2}}{n_1} + \frac{s_{2}^{2}}{n_2}}} [/Tex]
[Tex]t = \frac{\overline{d}}{\frac{s_d}{\sqrt{n}}} [/Tex] About VarianceF-test:The F-test is a statistical test that is used to compare the variances of two or more groups to assess whether they are significantly different. [Tex]F = \frac{s_{1}^{2}}{s_{2}^{2}} [/Tex] ANOVA (Analysis Of Varience)One-way Anova: Used to compare means of three or more groups to determine if there are statistically significant differences among them. here, H0: The means of all groups are equal. Ha: At least one group mean is different. Two-way Anova: It assess the influence of two categorical independent variables on a dependent variable, examining the main effects of each variable and their interaction effect. Confidence IntervalA confidence interval (CI) provides a range of values within which we can be reasonably confident that a population parameter lies. It is an interval estimate, and it is often used to quantify the uncertainty associated with a sample estimate of a population parameter.
|


Chi-Squared Test (Goodness of Fit) | Mann-Whitney U Test | Kruskal-Wallis Test |
|---|---|---|
The chi-squared test is used to determine if there is a significant association between two categorical variables. It compares the observed frequencies in a contingency table with the frequencies. [Tex]X^2=\Sigma{\frac{(O_{ij}-E_{ij})^2}{E_{ij}}} [/Tex] This test is also performed on big data with multiple number of observations. | Mann-Whitney U Test is used to determine whether there is a difference between two independent groups when the dependent variable is ordinal or continuous. Applicable when assumptions for a t-test are not met. In it we rank all data points, combines the ranks, and calculates the test statistic. | Kruskal-Wallis Test is used to determine whether there are differences among three or more independent groups when the dependent variable is ordinal or continuous. Non-parametric alternative to one-way ANOVA. |
A/B Testing or Split Testing
A/B testing, also known as split testing, is a method used to compare two versions (A and B) of a webpage, app, or marketing asset to determine which one performs better.
Example : a product manager change a website’s “Shop Now” button color from green to blue to improve the click-through rate (CTR). Formulating null and alternative hypotheses, users are divided into A and B groups, and CTRs are recorded. Statistical tests like chi-square or t-test are applied with a 5% confidence interval. If the p-value is below 5%, the manager may conclude that changing the button color significantly affects CTR, informing decisions for permanent implementation.
Reffered: https://www.geeksforgeeks.org
| AI ML DS |
Type: | Geek |
Category: | Coding |
Sub Category: | Tutorial |
Uploaded by: | Admin |
Views: | 14 |