|
|
Debugging is like finding and fixing mistakes in your computer code. PyCharm is a tool that helps with this, especially for Python code. It has special tools to make debugging easier. Whether you’re new to programming or have been doing it for a while, getting good at debugging in PyCharm can make you a better coder. In this article, we will see how to Perform debugging in PyCharm. Perform Debugging in Python PyCharmWhen we run the Python code it shows two modes.
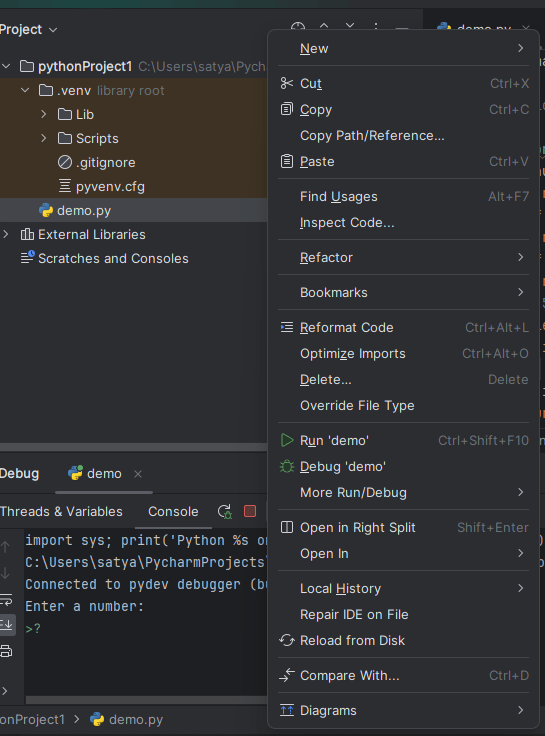
Now in this article let’s focus on debugging the Python script file using PyCharm. While operating debugging there are some steps to be followed. Step 1: Access Project Files in PyCharmOpen the project file and click the left button of the mouse. Then the following display will appear. Step 2: Start Debugging in PyCharmAfter clicking on a option Debug or press ‘Shift+F9’ , The Window firewall displays a pop-up message for debugging the project file for line by line compilation. 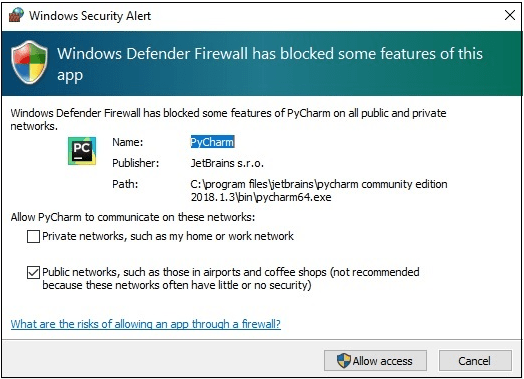 Step 3: Access Debugging ControlsAfter setting the permission then PyCharm starts debugging, the debugging executes till it reaches the break point, all the debugging controls will displayed on debug tool window. Lets take an example of a Python program in which we perform an operation of debugging in python. -min-min.png) Place a Breakpoints in the code by clicking on the number to suspend the program when Exception or its subclasses are thrown. 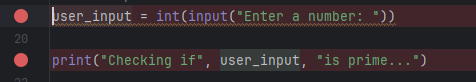 Step 4: Controls in PyCharm’s Debug Tool WindowIn the debug tool window, we will find various controls to help us navigate through our code while debugging. Now let us see some of the most commonly used tools. 
Step 5 : Inspect variable and Expression Evaluation in DebuggingWe can inspect the values of variables in our code by hovering over them with our mouse or by using the “Variables” pane present in the debug tool window. Similarly we can also evaluate expressions and watch variables by typing them into the “Evaluate Expression” field in the debug tool window. Step 6: Terminate DebuggingIf any error was found simply edit the code in the editor window and PyCharm will automatically save the changes. After completing the debugging session terminate the session by clicking the “Stop” icon in debug tool window and or by pressing “Ctrl+F2”. Inline DebuggingInline Debugging a technique where we can inspect the values of variables and expressions directly in our code. This is used for quick state of code at specific points during execution. 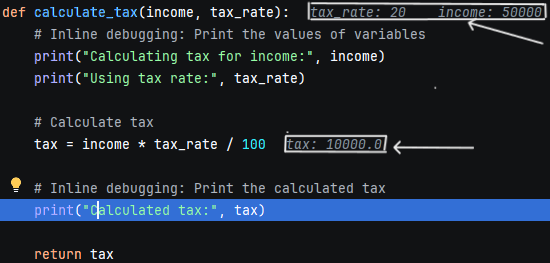 Inline Debugging The above indicated points are the inline debugging which shows expression directly in our code. By following Process we can performing the debugging in PyCharm and by debugging tools built into PyCharm, we can easily identify and fix issues in our code. |
Reffered: https://www.geeksforgeeks.org
| Python |
Type: | Geek |
Category: | Coding |
Sub Category: | Tutorial |
Uploaded by: | Admin |
Views: | 14 |