|
Chart.js is a popular JavaScript library for creating interactive and visually appealing charts on the web. While the library provides a basic way to render charts, displaying data values directly on the charts can enhance the user experience by providing context and clarity. In this article, we will explore various approaches to displaying data values on charts.
Display Data on Basic Chart
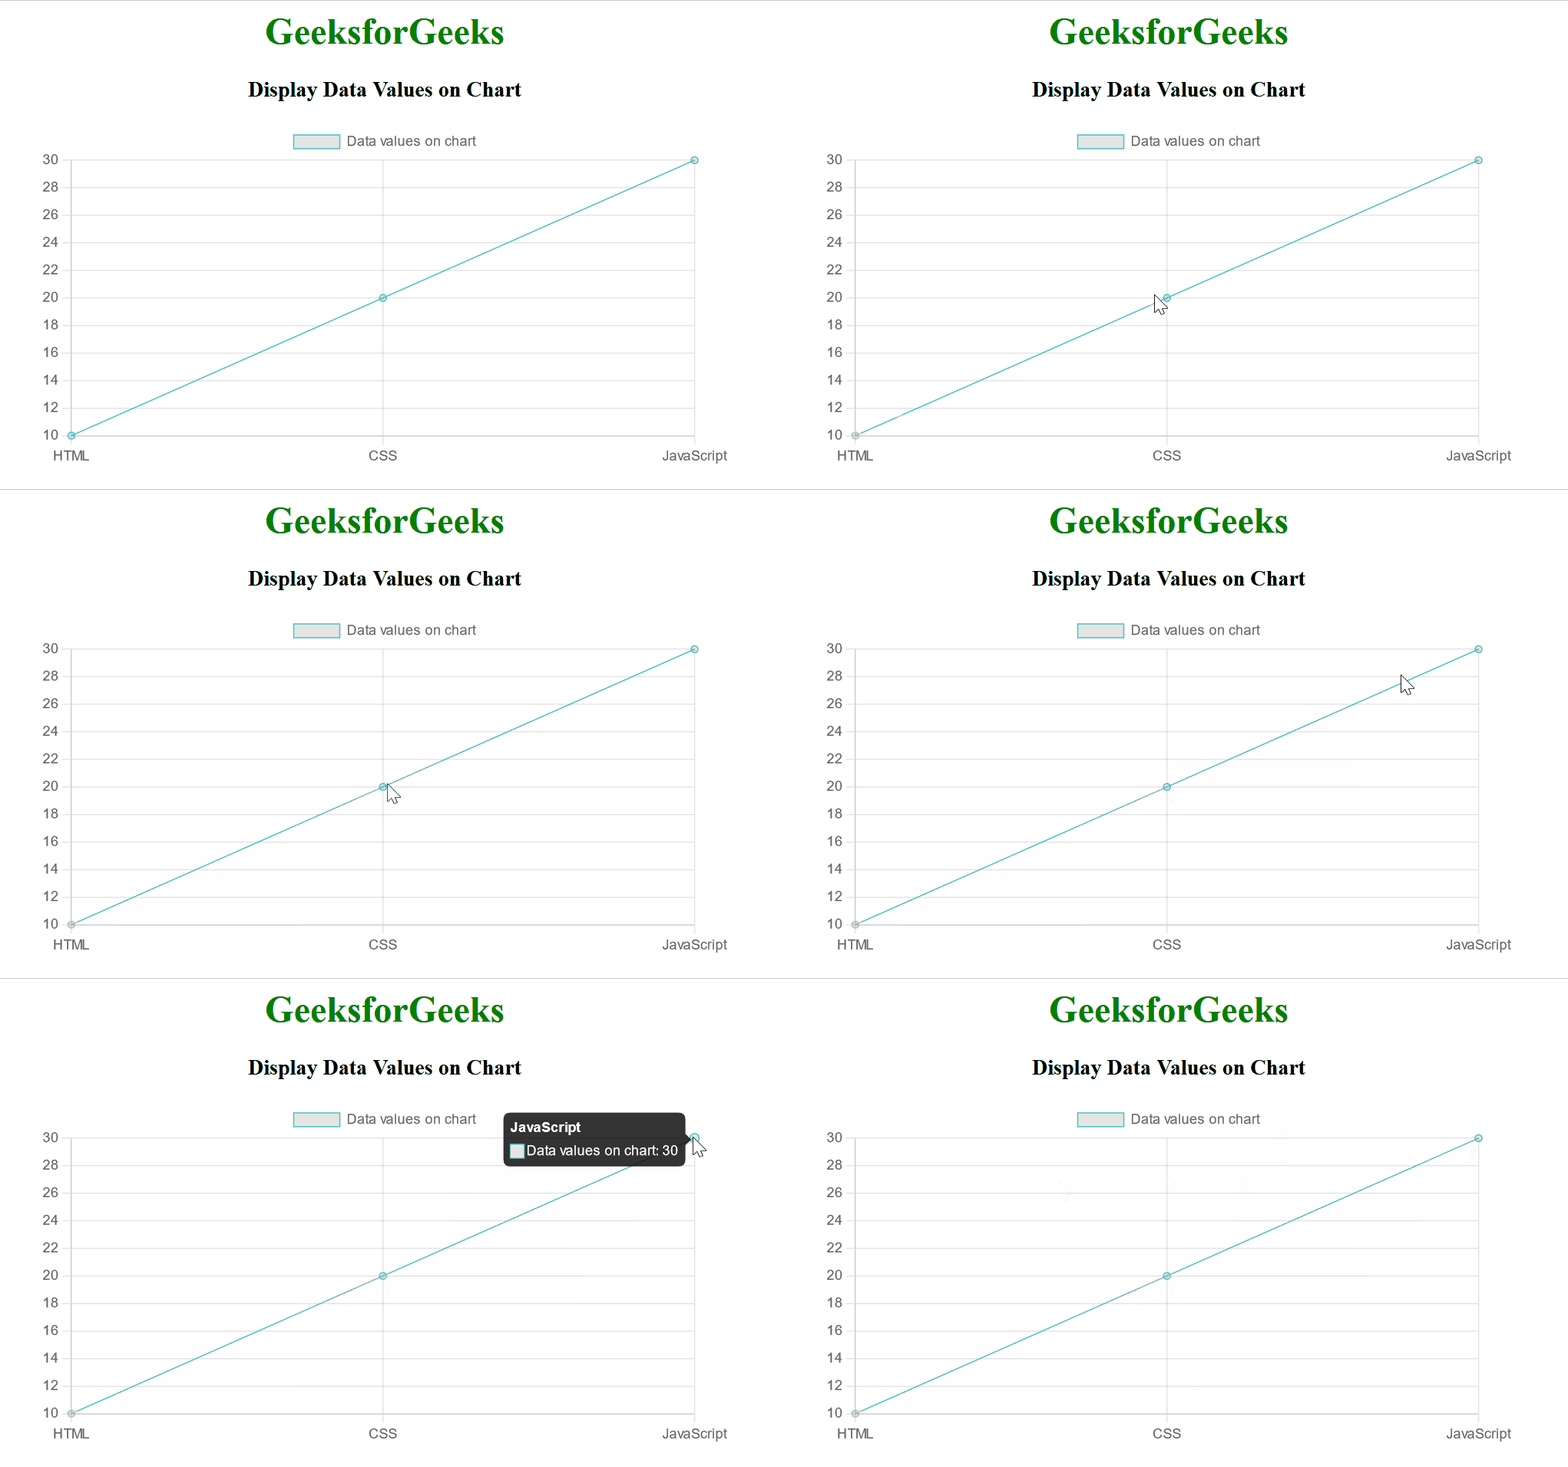
Chart.js supports annotations that allow you to add custom elements to your charts, including text labels for data values. This code demonstrates how to display data values on a basic chart using HTML, CSS, and JavaScript with the Chart.js library. The HTML structure includes a canvas element where the chart will be rendered.
Example:
HTML
<!DOCTYPE html>
<html>
<head>
<title>Display Data Values on Chart</title>
<script src=
</script>
<script src=
</script>
<style>
body {
text-align: center;
}
div {
width: 600px;
height: 350px;
margin: auto;
}
</style>
</head>
<body>
<h1 style="color:green;">
GeeksforGeeks
</h1>
<h3>Display Data Values on Chart</h3>
<div>
<canvas id="dataValues"></canvas>
</div>
<script>
new Chart($("#dataValues"), {
// type: 'bubble',
type: 'line', // Replace with your chart type
data: {
labels: ['HTML', 'CSS', 'JavaScript'],
datasets: [{
label: 'Data values on chart',
data: [10, 20, 30],
borderColor: 'rgba(75, 192, 192, 1)',
borderWidth: 1,
}],
},
options: {
annotation: {
annotations: [{
type: 'line',
mode: 'vertical',
scaleID: 'x-axis-0',
value: 'Label 1',
borderColor: 'red',
borderWidth: 2,
label: {
content: 'Value: 10',
enabled: true,
},
}],
},
},
});
</script>
</body>
</html>
|
Output:

Display Data on Pie Chart
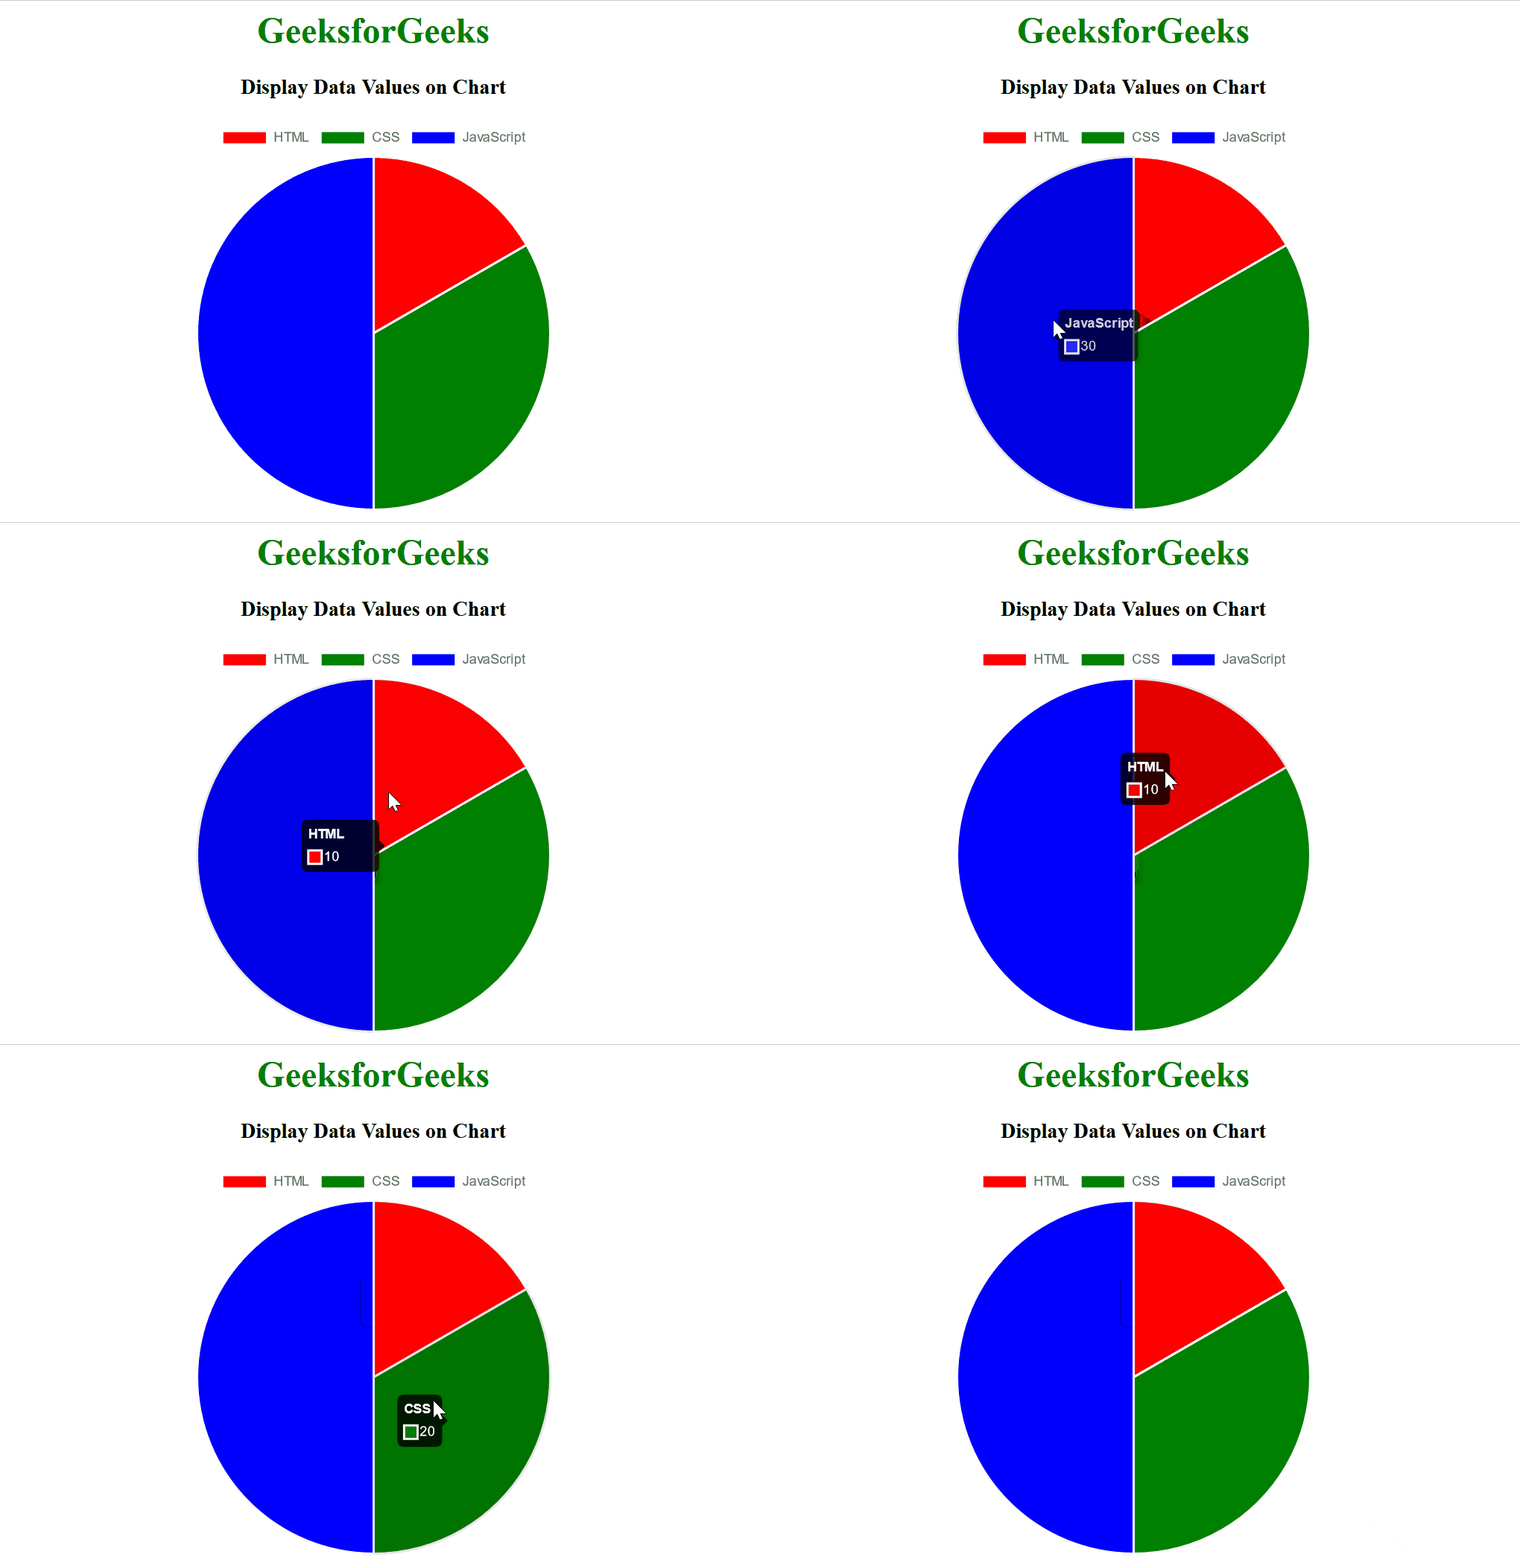
This code demonstrates how to display data on a pie chart using HTML, CSS, and JavaScript with the Chart.js library. The HTML structure includes a canvas element where the pie chart will be rendered. The JavaScript section initializes a new Chart instance with the type set to ‘pie’. The data object contains labels for the segments of the pie chart and datasets with data values and background colors for each segment. The chart is styled with CSS to center-align the text and set the dimensions of the div containing the canvas. Overall, this code provides a basic setup for displaying data on a pie chart.
Example: Pie chart is used to display the data.
HTML
<!DOCTYPE html>
<html>
<head>
<title>Display Data Values on Chart</title>
<script src=
</script>
<script src=
</script>
<style>
body {
text-align: center;
}
div {
width: 350px;
height: 350px;
margin: auto;
}
</style>
</head>
<body>
<h1 style="color:green;">
GeeksforGeeks
</h1>
<h3>Display Data Values on Chart</h3>
<div>
<canvas id="dataValues"></canvas>
</div>
<script>
new Chart($("#dataValues"), {
type: 'pie',
data: {
labels: ['HTML', 'CSS', 'JavaScript'],
datasets: [{
data: [10, 20, 30],
backgroundColor: ['red', 'green', 'blue'],
}],
},
options: {
onRender: function (chart) {
const ctx = chart.ctx;
chart.data.datasets.forEach((dataset, datasetIndex) => {
const meta = chart.getDatasetMeta(datasetIndex);
meta.data.forEach((bar, index) => {
const data = dataset.data[index];
const x = bar._model.x;
const y = bar._model.y;
ctx.fillText(data, x, y - 5);
});
});
},
}
});
</script>
</body>
</html>
|
Output:

|

