
|
|
Spring Boot is one of the most popular application development frameworks among developers. Spring boot can be used to develop standalone Java enterprise-level applications. Spring framework also provides features for ease of development and better security and performance in spring applications. Though Logging and Monitoring are not always required to build and maintain Spring applications, it’s a good practice to include features of logging and monitoring in our application. It becomes essential for entry-ready applications to have logging features and monitoring features.
Through this article, we will learn how we can implement Logging and Monitoring in Spring Boot Applications. If you are new to Spring Application development, check out the tutorial of Spring Boot on GFG – Spring Boot Tutorial Monitoring in Spring BootSpring Boot comes with additional features for Management and Monitoring Spring applications. Monitoring becomes very helpful when we push our application in production. We can check all the details about our application and manage it using HTTP endpoints. For Monitoring purposes, we are going to use Spring Boot Actuator. Step 1: Create a Spring Boot projectGo to start.spring.io and create a spring boot project. Choose the configuration as follows:
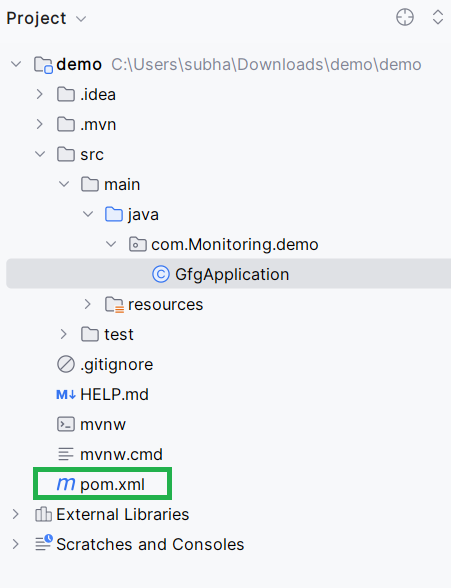
Download the spring project and open in any IDE.
Step 2: Add Spring Boot Actuator DependencyOnce you open your project in an IDE, navigate to pom.xml file.
Now add the following dependency for Spring boot actuator: <dependencies> If you are using a Gradle build, use the following: dependencies { Now wait for some-time for Spring boot to configure the dependency automatically. Pom.xml XML
Step 3: Application ConfigurationOpen application.properties file inside resource folder and add the following configurations: management. endpoints.web.base-path=/admin The above code will allow us to see Monitoring information on “/admin” page and we will be able to see endpoints for monitoring. We have also enabled health status to show all details always. Step 4: Monitor Spring Boot applicationRun your spring boot application which will by default start at port no 8080. Please keep in mind that we haven’t created any controller so you will see a “Whitelabel Error Page” at localhost:8080.
After we have run our application, you can see that it is exposing 13 endpoints for Monitoring purpose, and we can access it on “localhost:8080/admin“. Let’s open our web browser and see if we can monitor. localhost:8080/admin
{ The above is the output we are getting at “/admin” which include bean information, mapping information, metrics, cache, scheduled tasks and other details about the spring boot application. You can individually click on the links provided for more specific monitoring. Let’s check the health section: http://localhost:8080/admin/health
So, we are able to see that our application is running without any issues and details like diskspace, ping, etc. are provided for monitoring. Logging in Spring BootSpring Boot uses SLF4J (Simple Logging Facade for Java) for logging, and Logback as the default logging implementation. We can customize logging configurations by providing xml file in our classpath. This allows us to control log levels, appenders, and formatting. Different log levels are DEBUG, INFO, WARN, ERROR. We can configure log levels appropriately to ensure that our logs provide the necessary information without providing us logs with unnecessary details. To manage log file sizes and prevent them from growing indefinitely, we can configure Logback rolling policies. To implement Logging the first step will be creating a Spring boot application, as we have already created on for Monitoring, we will use the same. You can create a new one if you want. Follow step 1 of Monitoring in Spring Boot for reference. Now when we create Spring boot application, spring boot starters do all necessary configurations for us and here we can trigger the logging features with just creating a Controller and we will be able to see logs in the console. Let’s Create one Controller and name it LoggingController. LoggingController.java Java
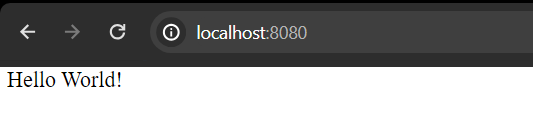
Here our controller is mapped to “/” in localhost and will print “Hello World!” message.
We have used Logger logger = LoggerFactory.getLogger(LoggingController.class); which is logging in a Java application, especially when using the SLF4J logging framework with Logback as the underlying implementation.
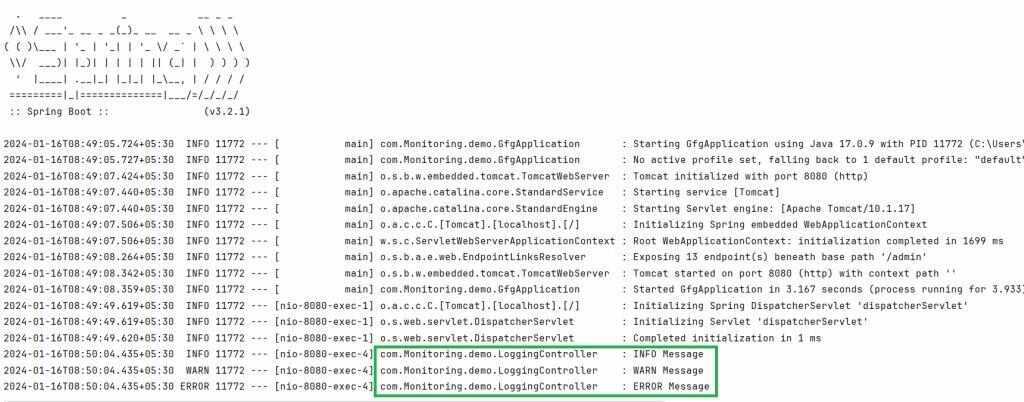
Let’s run the application and check the console for Logs.
Now we can configure the Logging as per our needs. To store the logs, we can create one log file and store them. These all-logging configurations are requirement specific and can be implemented for your ease of tracing. ConclusionSpring boot comes with spring starter and actuator being one of the components of spring boot makes the configurations easy for Monitoring and Logging. Tools like Spring Boot Actuator, Spring Boot Admin, and Logback provides developers with capabilities to ensure that their application is reliable and optimized for performance. By using best practices in monitoring and logging, we can easily identify and address issues, leading to a more robust and stable application. |


Reffered: https://www.geeksforgeeks.org
| Advance Java |
Type: | Geek |
Category: | Coding |
Sub Category: | Tutorial |
Uploaded by: | Admin |
Views: | 12 |