|
|
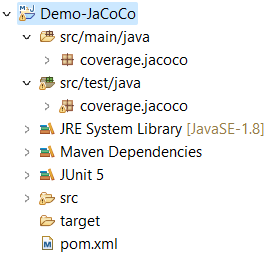
In simple terms, code coverage means measuring the percentage of lines of code that are executed during automated tests. For example, if you have a method containing 100 lines of code and you are writing a test case for it, code coverage tells you briefly how many of those lines were actively exercised by the test. JaCoCo Code Coverage with the Example of String PalindromeJaCoCo is an open-source library for measuring Java code coverage under the Eclipse Public License. Let’s initiate by creating a Maven project within Eclipse. The overall structure of the folder will look like this:
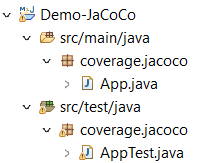
Once the standalone application is established, navigate to the main class i.e. App.java and compose a method to determine whether a given string input qualifies as a palindrome. Java
After successfully writing the palindrome-checking method, now we will test it. But before we start writing the test, we need to add few things to our project’s pom.xml file that are JUnit5 dependency and JaCoCo plugin. After adding, the pom.xml file will look like below: XML
Now, put App.java to the test and see how JUnit5 and JaCoCo work. We will do this using two easy steps. Phase: Testing the Reverse String MethodStep 1: Create a Test File: Let’s make a new file called “AppTest.java” specifically for testing the reverse string method. This is where we’ll write our first test case! |
package coverage.jacoco; import static org.junit.jupiter.api.Assertions.*; import org.junit.jupiter.api.Test; import coverage.jacoco.App; public class AppTest { String input1 = "noon"; //String input App app = new App(); boolean expected=true; @Test public void isPalindromeTest() { assertTrue(app.isPalindrome(input1)); //assertTrue test method } } |
Step 2: Run the Test Maven-Style: Now that our test is ready, it’s time to see how much code it covers. To do this, we’ll run the project as a Maven Test. Here’s how:
- Right-click on the main project folder in your IDE.
- Look for an option called “Run As” and select “Maven Test.”

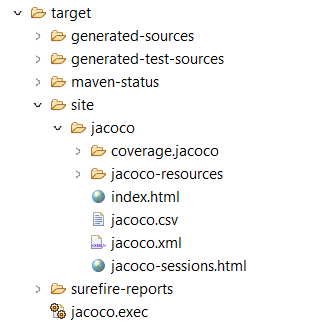
Step 3: Find the Coverage Report: Once the test runs, it will create a report showing us which parts of the code were tested and which were not. Here’s how to find it:
- Look for a folder called “target” inside your main project folder. It’s like a treasure chest holding the results of our test run!
- Open up the “target” folder, then the “site” folder, and finally the “jacoco” folder.
- You will see a file named “index.html”—that’s our coverage report! Click on it to take a peek inside.
When we click on “index.html,” it will open in our default browser, displaying a visual overview of our project’s code coverage.
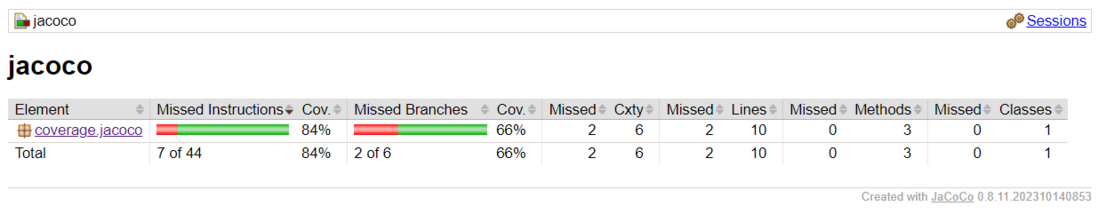
Click on the package name, which is “coverage.jacoco,” to reveal the class for which we wrote a test.
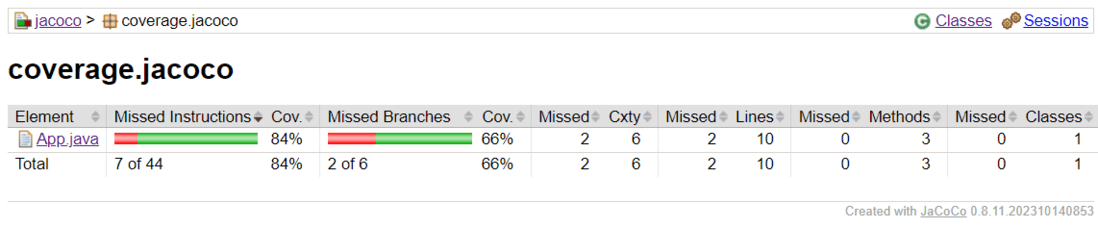
Click on “App.java” under the “Element” column. You’ll see lines highlighted in green, indicating the code sections successfully tested by our written test. To achieve 100% code coverage, focus on writing tests for the methods highlighted in red.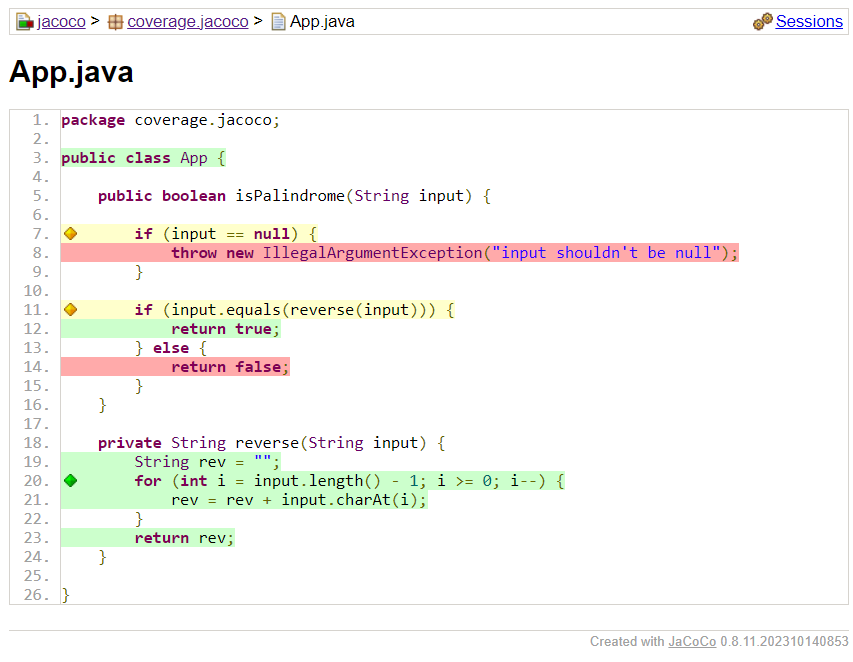
Phase 2: Conquering Complete Coverage
To achieve the 100% code coverage, let’s craft tests for all remaining methods. Upon completion, our AppTest.java file will look like this:
Java
package coverage.jacoco; import static org.junit.jupiter.api.Assertions.*; import org.junit.jupiter.api.Test; import coverage.jacoco.App; public class AppTest { String input1 = "noon"; App app = new App(); boolean expected=true; @Test public void isPalindromeTest() { assertTrue(app.isPalindrome(input1)); } @Test public void isNotPalindromeTest() { assertFalse(app.isPalindrome("abc")); } @Test public void isNotPalindromeExceptionTest() { assertThrows(IllegalArgumentException.class, () -> app.isPalindrome(null)); } } |
Do the steps that we have done in Phase 1, Step 2, to generate a fresh coverage report. .png)
Click on the package name, “coverage.jacoco” to view the class for which we’ve written a test.-min.png)
Now click on the App Class present under element column, we will see all the methods present in our code snippet are tested by our written test.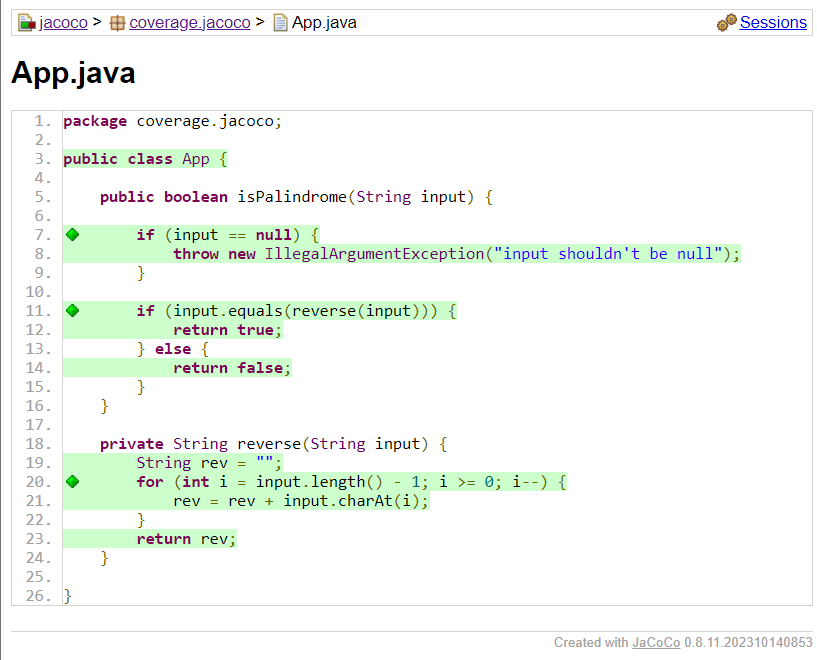
Key Takeaways of the Testing
Testing for Main Features Isn’t Enough: In Phase 1, we saw that even when we write tests for primary features, they might not test all the methods written by us. We have seen red marks in our results, indicating untested methods within our code snippets.
Coverage Targets Vary: The ideal code coverage percentage depends on project-specific factors. It is not necessary to achieve 100% code coverage in every case. If our written tests cover all the key feature methods, we can conduct a risk analysis to decide whether to write further tests. This can save time while working towards project deadlines.
FAQs pertaining to JUnit 5 – JaCoCo Code Coverage
1. What is displayed in a JaCoCo coverage report?
It draws attention to
- Total percentage of code coverage
- coverage of certain classes and techniques
- Code lines that are run during testing (green) or not (red)
2. What should be the ideal percentage of code coverage?
It is dependent upon the risk considerations and complexity of the project. In general, strive for:
- 70–80% for the majority of projects
- 80–90% for important or dangerous parts
- 100% in certain situations where risk is intolerable
3. What are the advantages of code coverage with JaCoCo?
Advantages of code coverage with JaCoCo
- Provides comprehensive HTML reports for simple examination
- easily combines with Maven and additional build tools
- supports different metrics for coverage (line, branch, method)
- Suitable for quality control and ongoing integration
Reffered: https://www.geeksforgeeks.org
| Advance Java |
Type: | Geek |
Category: | Coding |
Sub Category: | Tutorial |
Uploaded by: | Admin |
Views: | 13 |