|
|
R is a statistical programming language that provides a set of tools, packages, and functions that help in data analysis. Predict() function is a powerful tool from the R language used in the field of data analysis and predictive modelling. In R Programming Language This function plays an important role in extracting relevant information from our models making it easier for the researchers to predict future values. In this article, we will understand the use of this function with the help of examples. Understanding the Predict() FunctionThis is a built-in function in the R language used to extract predicted values from complex machine-learning models widely used by analysts.
Implementation of Predict()To utilize this function effectively we need to follow certain steps.
Before trying to understand the workflow of this function with the help of examples we need to understand the libraries we will use in this article. Important Libraries
Build the modsel and Predict values Using Predict functionEnvironmental Science uses machine learning widely to predict the effect of climate change on other factors such as humidity or temperature. We will create fictional data on this problem and then try to use our function to get useful information. Step 1: Install and Load Required PackagesrandomForest package is widely used in environmental science mostly in predicting future values. R
Step 2: Prepare and Preprocess DataWe will take a small fictional dataset for this example based on temperature, humidity, and pollutant concentration and split the data into training and testing sets R
Output: temperature humidity pollutant_concentration Step 3: Fit the Predictive ModelrandomForest model will be used here for more accurate predictions. R
Step 4: Generate PredictionsBased on the model we used for predicting pollutant concentration based on temperature and humidity R
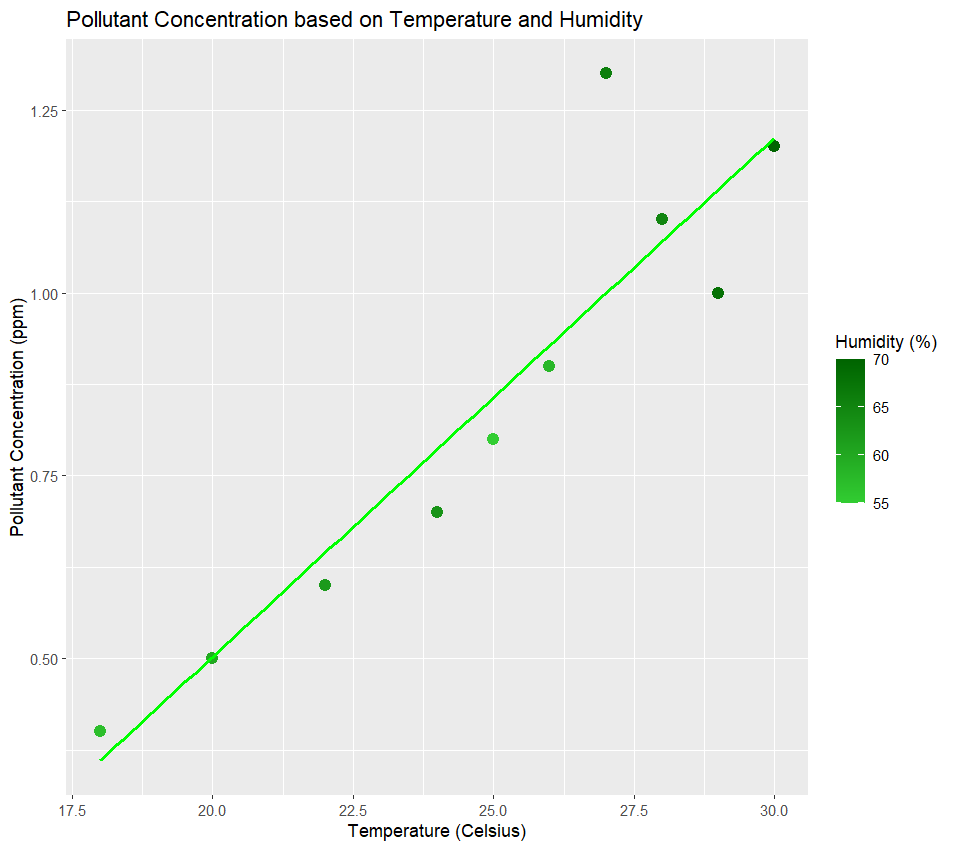
Output: 2 5 7 Step 5: Visualize Predictions:ggplot2 is used to plot the graph. R
Output: Pollutant Conc vs humidity+Temperature The color gradient represents the humidity level of the data and the line shows the best fit of our model. Step 7: Post-Processing AnalysisR
Output: "Mean Absolute Error: 0.123982222222222" Mean Absolute Error: This shows the average of deviation of predicted values from the actual values. A lower MAE value shows the model has good accuracy. In this example, we used the randomForest model to predict pollutant concentration based on variables such as humidity and temperature. We also checked the accuracy of the model. Such type of research help the scientist to understand the trends of the data and make informed decisions. Implement predict function on Food Production datasetNow we will work on a dataset downloaded from the Kaggle website based on the Environment Impact of Food Production. R
Output: Land.use.change Animal.Feed Upload the dataset and print the head of the data. R
Output: 1 2 3 4 5 6 These are the first six predictions of the dependent variable we are predicting here. We got values for Animal Feed in kgs understanding how independent variable Land Use change affects it. It helps us to understand the relationship between these two variables. Visualize PredictionsR
Output: 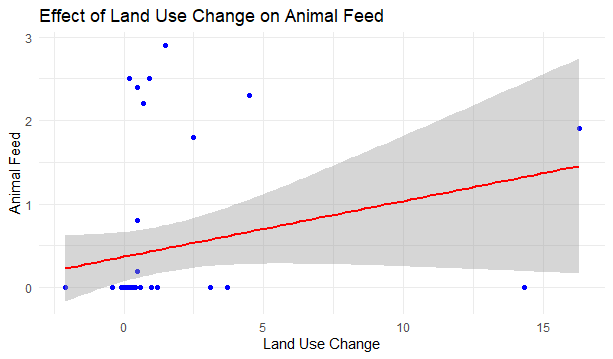 Predict() function in R The dots represent the corresponding data points of each observation in our dataset and the line in green shows the best fit for the linear model we made. Post-Processing AnalysisHere, we will check the correlation between the variables which represents the relationship between them. It indicates the strength of the linear relationship. R
Output: "Correlation between Land Use Change and Animal Feed: 0.243623946455937" This output suggests a weak positive linear relationship between ‘Land Use Change’ and ‘Animal Feed’ This means if the change in land use changes there are chances that animal feed will increase as well but the relationship is not that strong. This gave us a rough insight into our data. ConclusionThis article explored the functions of extractPrediction() with the help of multiple real-life-based examples and explored statistical analysis in the last step to check the accuracy of the model we are building. We used ggplot2 to plot graphs of our predictions and visualized our results. Such predictions are widely used by researchers to analyze and make better decisions in different fields. |
Reffered: https://www.geeksforgeeks.org
| AI ML DS |

Type: | Geek |
Category: | Coding |
Sub Category: | Tutorial |
Uploaded by: | Admin |
Views: | 14 |