
|
|
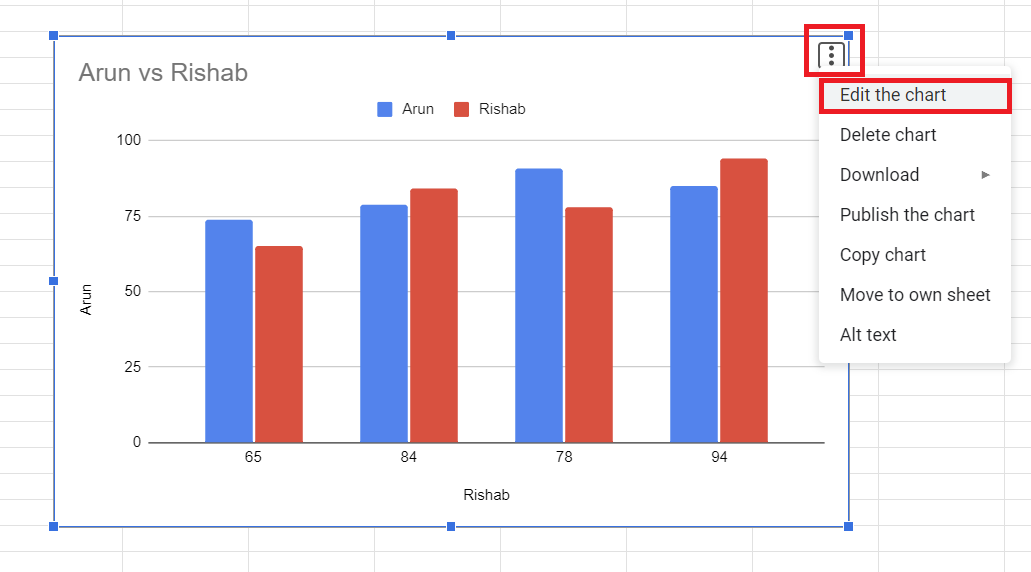
Google Sheets is one of the most popular cloud-based spreadsheet applications developed by Google as a part of Google Workspace. It is very similar to MS Excel as it enables us to create and edit our data on spreadsheets and also enables us to share our spreadsheets with our co-workers or peers online. Changing the colors of charts in Google Sheets is a powerful way to enhance visual impact and draw attention to the most important aspects of your data. By tweaking the color schemes, you can highlight trends, patterns, and outliers more effectively, making your charts not just more attractive, but also more informative. Here we will learn, How to Change Chart Colors in Google Sheets. How to Change Chart Colors in Google Sheets Change Chart Color in Google SheetsStep 1: Open your Google Sheets documentGo to your web browser open Google Sheets, login into your Google account. Step-2: Select the ChartSelect the Chart you want to edit by double-clicking on it. 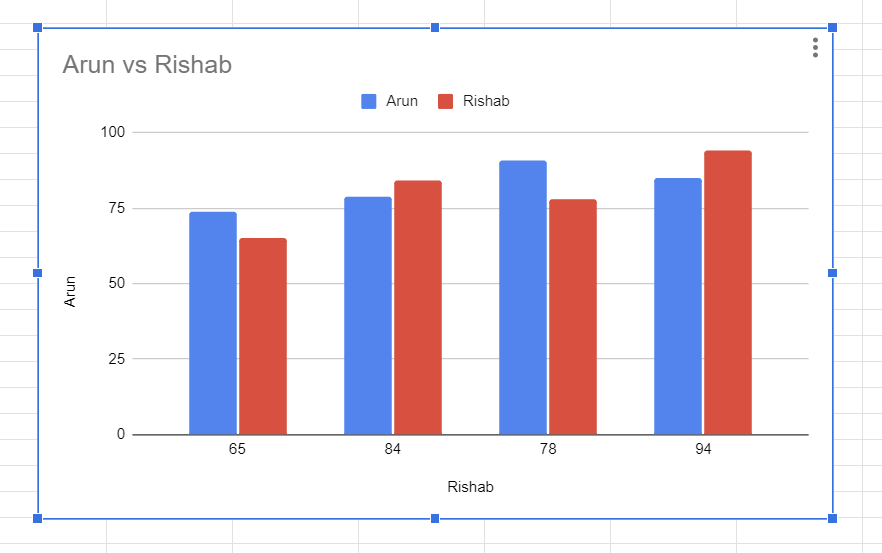 How to Change Chart Color in Google Sheets Step 3: Open the Chart EditorTo change the color of our Chart we first have to open the Chart Editor. To open Chart Editor – Double click on the chart to see the Chart Editor section in the right corner or, Click on the chart ->Click on the 3 dots on the top right corner of the chart-> Click on Edit the Chart.
 How to Change Color in Google Sheets 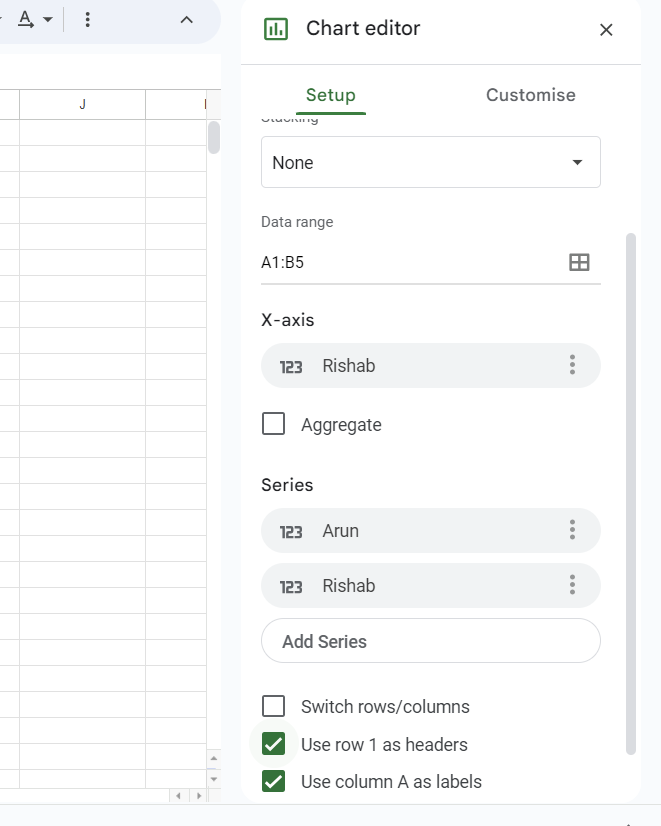 How to Change Chart Color in Google Sheets Step 4: Customize the Chart colorsAfter opening the Chart Editor we’ll have to open the Customise tab in Chart Editor. Click on Customise Tab -> Click on Series. 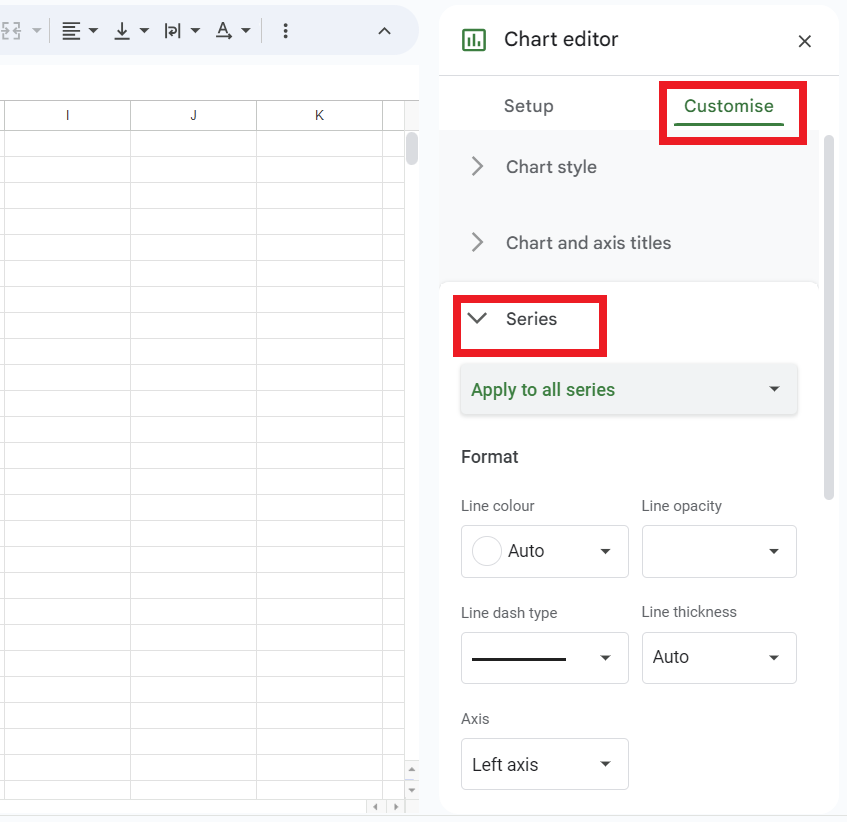 How to Change Chart Color in Google Sheets STEP-5. Select the SeriesSeries refers to the group of related data that are graphically represented in a chart. Each series represents a set of data that we want to compare or analyze. For example, if we are creating a bar graph representing the amount of sales in different years then the amount of sales in each separate year will be a separate series in the graph. To select the Series – Click on Apply to all Series and select the series whose color you want to change (In my case I have selected the Rishab Sales) 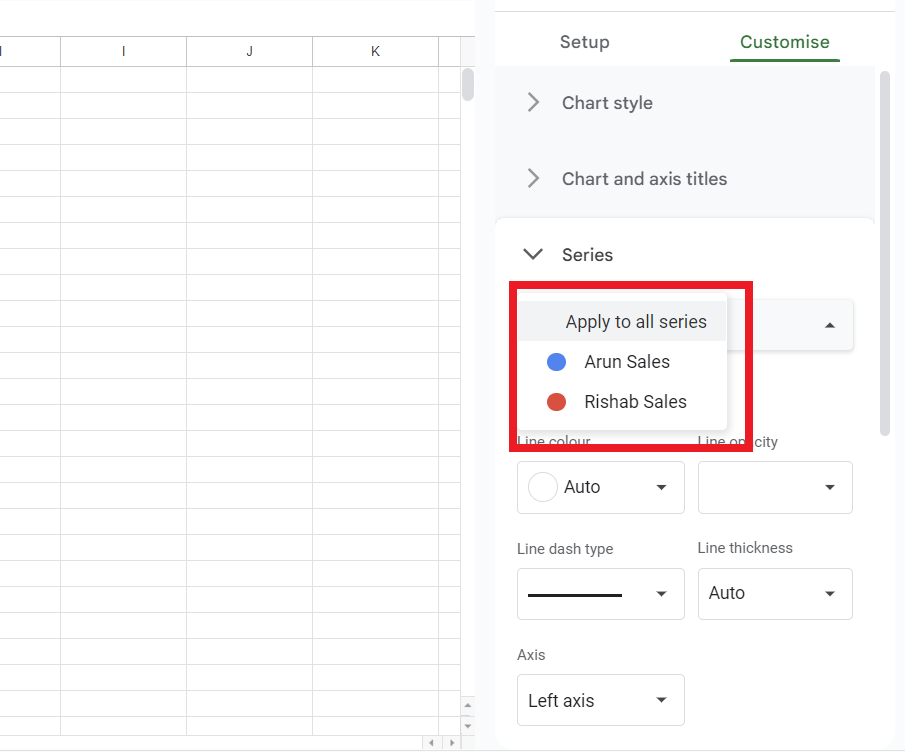 How to Change Chart Color in Google Sheets Step 6: Choose a ColorBelow the Select bar you will see a Format section -> Click on Fill Color and Select the color for your series, You can either choose from the color palettes or use a custom color. 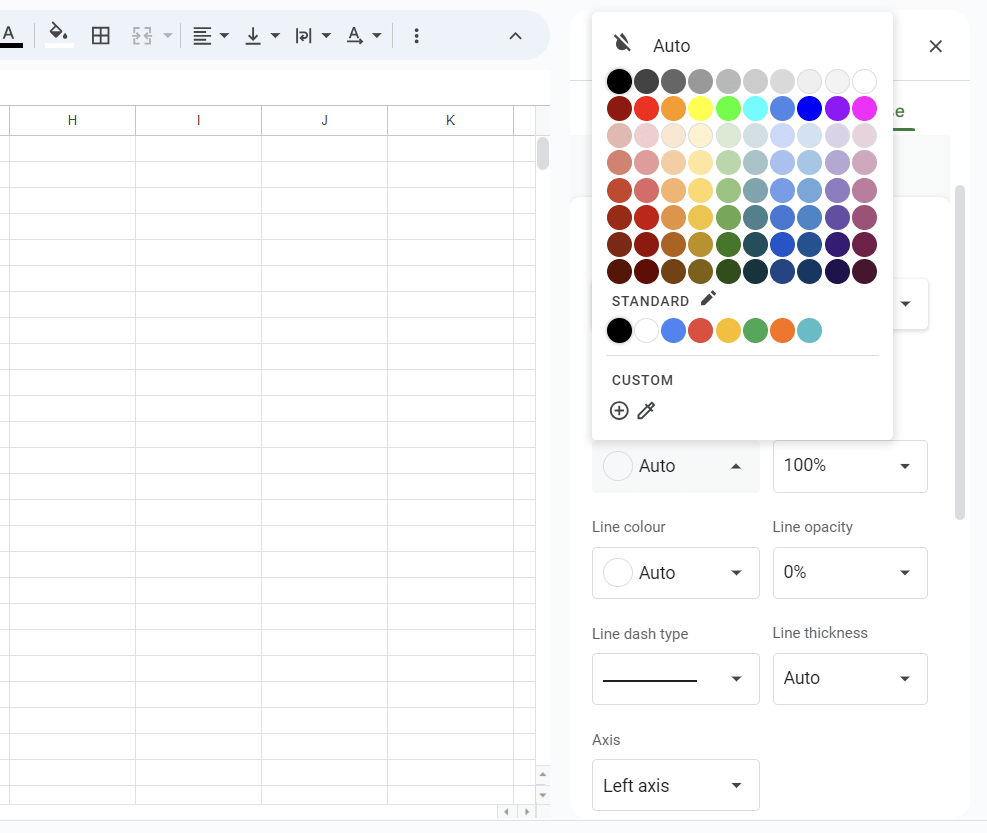 How to Change Chart Color in Google Sheets Step 7: Apply and Save the ChangesAfter adjusting the color you will see the colors of the graph will automatically change, now you use the same steps to change the color of all the Series in your graph accordingly. 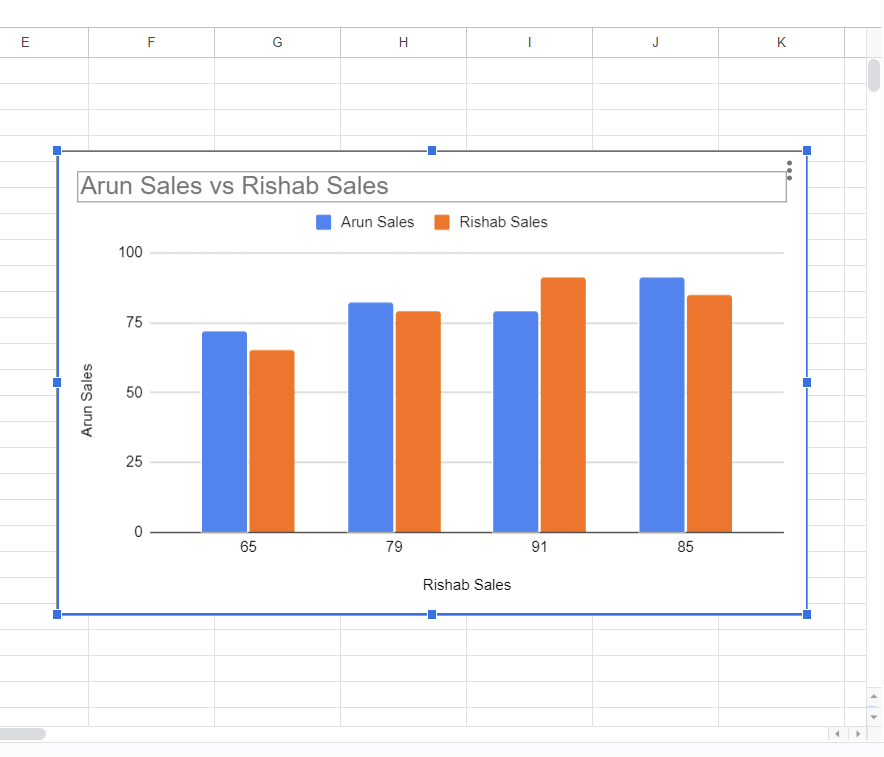 How to Change Chart Color in Google Sheets Step 8: Review your chart.The Chart will now reflect a new color scheme which you choose and if you’re satisfied with the color scheme of the chart you can close the Chart Editor. ConclusionIn conclusion, customizing the colors of your charts in Google Sheets is a simple yet effective way to enhance the clarity and impact of your data visualizations. We used Chart Editor to modify our chart, Chart Editor provided a user interface for modifying the design, colors, settings, and layout of the chart to make it look more visually appealing. Do remember that the steps in this article may slightly differ depending on the version of the Google Sheet you are using but the overall and general process of opening the Chart Editor and customizing the color of the chart in the Customise tab will be the same. How to Change Chart Colors in Google Sheets – FAQsHow do I customize a chart on Google Sheets?
How do I change the color of my chart?
How do I change the custom color in Google Sheets?
|
Reffered: https://www.geeksforgeeks.org
| Google Sheets |
| Related |
|---|
| |
Type: | Geek |
Category: | Coding |
Sub Category: | Tutorial |
Uploaded by: | Admin |
Views: | 11 |