|
|
Data Processing is an important part of any task that includes data-driven work. It helps us to provide meaningful insights from the data. As we know Python is a widely used programming language, and there are various libraries and tools available for data processing. In this article, we are going to see Data Processing in Python, Loading, Printing rows and Columns, Data frame summary, Missing data values Sorting and Merging Data Frames, Applying Functions, and Visualizing Dataframes. Table of Content
What is Data Processing in Python?Data processing in Python refers to manipulating, transforming, and analyzing data by using Python. It contains a series of operations that aim to change raw data into structured data. or meaningful insights. By converting raw data into meaningful insights it makes it suitable for analysis, visualization, or other applications.Python provides several libraries and tools that facilitate efficient data processing, making it a popular choice for working with diverse datasets.
What is Pandas?Pandas is a powerful, fast, and open-source library built on NumPy. It is used for data manipulation and real-world data analysis in Python. Easy handling of missing data, Flexible reshaping and pivoting of data sets, and size mutability make pandas a great tool for performing data manipulation and handling the data efficiently. Loading Data in Pandas DataFrameReading CSV file using pd.read_csv and loading data into a data frame. Import pandas as using pd for the shorthand. You can download the data from here. Python3
Printing rows of the DataBy default, data_frame.head() displays the first five rows and data_frame.tail() displays last five rows. If we want to get first ‘n’ number of rows then we use, data_frame.head(n) similar is the syntax to print the last n rows of the data frame. Python3
Output: CustomerID Genre Age Annual Income (k$) Spending Score (1-100) Printing the column names of the DataFramePython3
Output: ['CustomerID', 'Genre', 'Age', 'Annual Income (k$)', 'Spending Score (1-100)']
Summary of Data FrameThe functions info() prints the summary of a DataFrame that includes the data type of each column, RangeIndex (number of rows), columns, non-null values, and memory usage. Python3
Output: <class 'pandas.core.frame.DataFrame'> Descriptive Statistical Measures of a DataFrameThe describe() function outputs descriptive statistics which include those that summarize the central tendency, dispersion, and shape of a dataset’s distribution, excluding NaN values. For numeric data, the result’s index will include count, mean, std, min, and max as well as lower, 50, and upper percentiles. For object data (e.g. strings), the result’s index will include count, unique, top, and freq. Python3
Output: CustomerID Age Annual Income (k$) Spending Score (1-100) Missing Data HandingFind missing values in the datasetThe isnull( ) detects the missing values and returns a boolean object indicating if the values are NA. The values which are none or empty get mapped to true values and not null values get mapped to false values. Python3
Output: CustomerID Genre Age Annual Income (k$) Spending Score (1-100) Find the number of missing values in the datasetTo find out the number of missing values in the dataset, use data_frame.isnull( ).sum( ). In the below example, the dataset doesn’t contain any null values. Hence, each column’s output is 0. Python3
Output: CustomerID 0 Removing missing valuesThe data_frame.dropna( ) function removes columns or rows which contains atleast one missing values. data_frame = data_frame.dropna()
By default, data_frame.dropna( ) drops the rows where at least one element is missing. data_frame.dropna(axis = 1) drops the columns where at least one element is missing. Fill in missing valuesWe can fill null values using data_frame.fillna( ) function. data_frame = data_frame.fillna(value)
But by using the above format all the null values will get filled with the same values. To fill different values in the different columns we can use. data_frame[col] = data_frame[col].fillna(value)
Row and column manipulationsRemoving rowsBy using the drop(index) function we can drop the row at a particular index. If we want to replace the data_frame with the row removed then add inplace = True in the drop function. Python3
Output: CustomerID Genre Age Annual Income (k$) Spending Score (1-100) This function can also be used to remove the columns of a data frame by adding the attribute axis =1 and providing the list of columns we would like to remove. Renaming rowsThe rename function can be used to rename the rows or columns of the data frame. Python3
Output: CustomerID Genre Age Annual Income (k$) Spending Score (1-100) Adding new columnsPython3
Output: CustomerID Genre Age Annual Income (k$) Spending Score (1-100) \ Sorting DataFrame valuesSort by columnThe sort_values( ) are the values of the column whose name is passed in the by attribute in the ascending order by default we can set this attribute to false to sort the array in the descending order. Python3
Output: CustomerID Genre Age Annual Income (k$) Spending Score (1-100) \ Sort by multiple columnsPython3
Output: CustomerID Genre Age Annual Income (k$) Spending Score (1-100) \ Merge Data FramesThe merge() function in pandas is used for all standard database join operations. Merge operation on data frames will join two data frames based on their common column values. Let’s create a data frame. Python3
Output: Name Age Qualification Now we will create another data frame. Python3
Output: Name Salary Now. let’s merge these two data frames created earlier. Python3
Output: Name Age Qualification Salary Apply FunctionBy defining a function beforehandThe apply( ) function is used to iterate over a data frame. It can also be used with lambda functions. Python3
Output: CustomerID Genre Age Annual Income (k$) Spending Score (1-100) \ By using the lambda operatorThis syntax is generally used to apply log transformations and normalize the data to bring it in the range of 0 to 1 for particular columns of the data. Python3
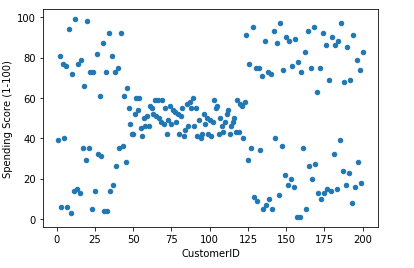
Output: CustomerID Genre Age Annual Income (k$) Spending Score (1-100) \ Visualizing DataFrameScatter plotThe plot( ) function is used to make plots of the data frames. Python3
Output: Scatter plot of the Customer Satisfaction column HistogramThe plot.hist( ) function is used to make plots of the data frames. Python3
Output: 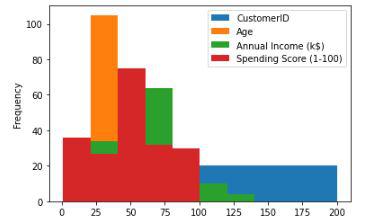 Histogram for the distribution of the data ConclusionThere are other functions as well of pandas data frame but the above mentioned are some of the common ones generally used for handling large tabular data. One can refer to the pandas documentation as well to explore more about the functions mentioned above. |
Reffered: https://www.geeksforgeeks.org
| Python |
Type: | Geek |
Category: | Coding |
Sub Category: | Tutorial |
Uploaded by: | Admin |
Views: | 10 |