|
|
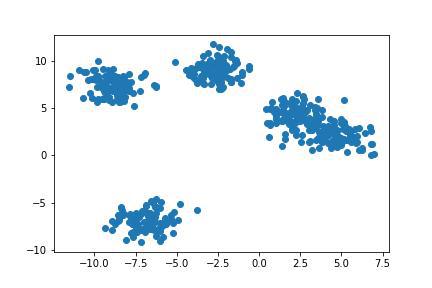
In this article, we shall look at different approaches to evaluate Clustering Algorithms using Scikit Learn Python Machine Learning Library. Clustering is an Unsupervised Machine Learning algorithm that deals with grouping the dataset to its similar kind data point. Clustering is widely used for Segmentation, Pattern Finding, Search engine, and so on. Let’s consider an example to perform Clustering on a dataset and look at different performance evaluation metrics to evaluate the model. Python3
Output:
In this dataset, we shall use KMeans Clustering Algorithm which is a density-based Clustering Algorithm. Python3
Output: 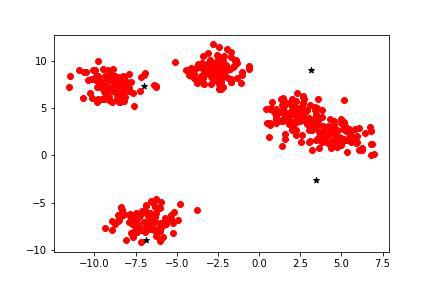
Performance Evaluation MetricsOnce we build a model, we usually do some predictions. But how do we verify the results? and on what basis do we come to the conclusion? That is when Evaluation Metrics come into the picture. Evaluation Metrics are the critical step in Machine Learning implementation. These are mainly used to evaluate the performance of the model on the inference data or testing data in comparison to actual data. Now let us see some common Clustering Performance Evaluations in Scikit Learn. 5 Commonly used Clustering Performance Evaluation MetricsAdjusted Rand IndexThe adjusted rand index is an evaluation metric that is used to measure the similarity between two clustering by considering all the pairs of the n_samples and calculating the counting pairs of the assigned in the same or different clusters in the actual and predicted clustering. The adjusted rand index score is defined as: ARI = (RI - Expected_RI) / (max(RI) - Expected_RI) Python3
Output: 0.7812362998684788 A score above 0.7 is considered to be a good match. Rand IndexThe Rand index is different from the adjusted rand index. Rand index does find the similarity between two clustering by considering all the pairs of the n_sample but it ranges from 0 to 1. whereas ARI ranges from -1 to 1. The rand index is defined as: RI = (number of agreeing pairs) / (number of pairs) Python3
Output: 0.9198396793587175 Silhouette Score aka Silhouette CoefficientSilhouette score aka Silhouette Coefficient is an evaluation metric that results in the range of -1 to 1. A score near 1 signifies the best importance that the data point is very compact within the cluster to which it belongs and far away from the other clusters. The score near -1 signifies the least or worst importance of the data point. A score near 0 signifies overlapping clusters. Python3
Output: 0.7328381899726921 4. Davies-Bouldin IndexDavies-Bouldin Index score is defined as the average similarity measure of each cluster with its most similar cluster, where similarity is the ratio of within-cluster distances to between-cluster distances. Thus, clusters that are farther apart and less dispersed will result in a better score. The minimum score is 0, with lower values indicating better clustering. Python3
Output: 0.3389800864889033 Mutual InformationMutual Information between two clusters is a measure of the similarity between two labels of the same data. That is it is used to check the mutual information in the actual label target vs the predicted model label. Python3
Output: 1.3321790402101235 |
Reffered: https://www.geeksforgeeks.org
| AI ML DS |
Type: | Geek |
Category: | Coding |
Sub Category: | Tutorial |
Uploaded by: | Admin |
Views: | 11 |