|
In a binomial distribution, the probability of achieving success must stay consistent across the trials being examined. For instance, when tossing a coin, the probability of landing heads is always ½ for each trial, as there are only two possible outcomes.Explanation: Probability is the likelihood of something happening. When we say the probability of something, it means how likely that something is. Some events have a high probability and are very likely to happen, and some have less probability which means they are very unlikely to happen. Examples – The probability of getting a tail on tossing an unbiased coin is 1/2 and the probability of getting a number greater than 4 on rolling dice is 1/3. In other words, it is the measure of the chance that the event will occur as a result of an experiment. Probability theory is a very powerful instrument for organizing, interpreting, and applying information which is very useful in various domains like data science, trading, betting of horses, etc. Binomial ExperimentA Binomial experiment is an experiment in which there are a fixed number of trials (say n), every trial is independent of the others, only 2 outcomes: success or failure, and the probability of each outcome remains constant from trial to trial. Examples of the binomial experiments,
Binomial ProbabilityWhen there is given any binomial experiment in which we are performing random experiments multiple times (for example, tossing a coin 7 times or rolling a dice 10 times ), then finding out the probability of a certain outcome in n trials is called its binomial probability. Consider a binary experiment has n independent trials with two outcomes:
Now the Probability of getting r successes in n trials is:
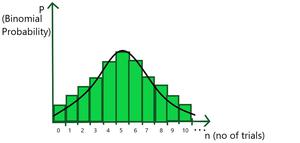
where p = probability of success and q = probability of failure such that p + q = 1. Graphical Representation of symmetric Binomial Distribution The binomial distribution consists of multiple Bernoulli’s events. The difference between Bernoulli’s distribution and Binomial distribution is that the expected value of Bernoulli’s distribution gives the expected outcome for a single trial while the expected value of Binomial distribution suggests the number of times expected to get a specific outcome. The graph of binomial distribution represents the likelihood of attaining our desired outcome a specific number of times.
Related Articles:Sample Problems – Binomial Probability Distribution with ExampleQuestion 1: If an unbiased coin is tossed 7 times, then find out the probability of getting exactly 3 heads. Solution:
Question 2: A dice is thrown 5 times, and getting an odd prime number is considered a success. Find the probability of:
Solution :
Question 3: Joker draws 4 cards from a well-shuffled deck of 52 cards with replacement. Find the probability that he draws at least 3 kings from the deck. Solution:
Question 4: You are giving an MCQ test having only 5 questions. In each question, 4 options are given and each question can have one or more than one correct answer. Since you have not studied anything for the test, you decide to mark all the answers at random. Find the probability that you get exactly 3 questions correct out of 5, to just pass your examination. Solution:
|
Reffered: https://www.geeksforgeeks.org
| Mathematics |

Type: | Geek |
Category: | Coding |
Sub Category: | Tutorial |
Uploaded by: | Admin |
Views: | 8 |