|
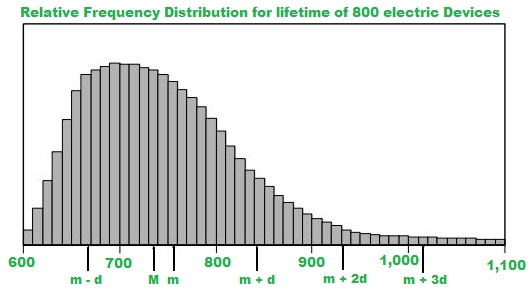
Distribution of Data:The distribution of a statistical data set (or a population) is a listing or function showing all the possible values (or intervals) of the data and how often they occur, we can think of a distribution as a function that describes the relationship between observations in a sample space. Example: The lifetimes of 800 electric devices were measured. Because the lifetimes had many different values, the measurements were grouped into 50 intervals, or classes, of 10 hours each: 601 to 610 hours, 611 to 620 hours, and so on, up to 1, 091 to 1, 100 hours. The resulting relative frequency distribution, as a histogram, has 50 thin bars and many different bar heights, as shown in Data Analysis Figure below.
Relative frequency is how often something happens divided by all outcomes. As an example here, it can be considered as the number of electric devices having lifetime of (Ex 601 to 610) divided by the total devices.
In the histogram, the median is represented by M, the mean is represented by m, and the standard deviation is represented by d.
Random Variable:A random variable can map each value from sample space to a real number and moreover sum of values from real number is always equal to 1 Example: In an experiment three fair coins are tossed, then sample space isS = { HHH, HHT, HTH, THH, HTT, TTH, THT, TTT}
Let variable X count the number of times head turns up, hence we call it as Random variable. Moreover random variable is generally represented by X.
Now, X can take values 3, 2, 1, 0
P(X = 1) is probability of occurring head one time,
P(X = 1) = P(THT) + P(TTH) + P(HTT) = 3/8
Types of random variable:
Probability Distribution:Probability distributions indicate the likelihood of an event or outcome. P(x) = the likelihood that random variable takes a specific value of x. Example: In an experiment three fair coins are tossed, then sample space is,S = {HHH, HHT, HTH, THH, HTT, TTH, THT, TTT}
X is random variable having values 3, 2, 1, 0 then
P(X = 0) = P(TTT) = 1/8
P(X = 1) = P(HTT) + P(TTH) + P(THT) = 3/8
P(X = 2) = P(HHT) + P(HTH) + P(THH) = 3/8
P(X = 3) = P(HHH) = 1/8
Therefore,
1. p(x)Probability Density Function: Let x be continuous random variable then probability density function F(x) is defined such that 1. F(x)Properties of Discrete Distribution: 1.Properties of Continuous Distribution: 1.Where, E(x) denotes expected value or average value of the random variable x, V(x) denotes the variance of the random variable x. Types of Distributions: |
 0
2.
0
2.  = 1
3. p(x) = P(X=x)
= 1
3. p(x) = P(X=x)  = 1
3. P(a < x < b) =
= 1
3. P(a < x < b) = 
 = 1
2. E(x) =
= 1
2. E(x) =  3. V(x) =
 = 1
2. E(x) =
= 1
2. E(x) =  3. V(x) =
Reffered: https://www.geeksforgeeks.org
| GRE |

Type: | Geek |
Category: | Coding |
Sub Category: | Tutorial |
Uploaded by: | Admin |
Views: | 14 |