|
|
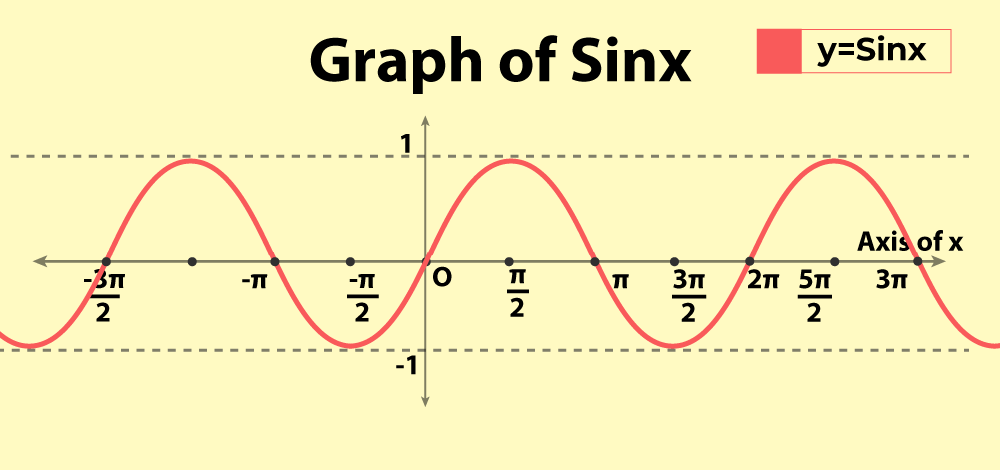
Sine and cosine functions are also some of the most basic functions that belong to the branch of mathematics called trigonometry and they are characterized by periodic oscillations; they are used in fields like physics, engineering and signal processing. These are used to describe waveforms and circular movements and are vital in such areas as sound waves light waves, and AC currents. The purpose of this article is to include a discussion of the properties of sine and cosine functions and detailed guidance on how best to graph such functions, including a discussion of pitfalls that one ought to avoid. What is a Sine Function?The sine function is usually written as sin(x) and its graph is sinusoidal or oscillates in a smooth wave-like manner. In mathematics, the sine function refers to the y-coordinate of an object moving in the circumference of a circle that creates the unit circle area. The function goes through the range [-1,1] and has a period of 2π from the x-axis. The sine function is very important in the study of cyclical behaviours and is one of the main functions in trigonometry. What is a Cosine Function?The cosine function is noted as cos (x) and resembles the sine function with the only difference being that at x= 0 the function’s value is 1. It denotes the position of a figure in the x-coordinate axis of a circle whose circumference is one unit. This function has a range-like sine function that is [-1, 1] and its period is 2π. The cosine function is highly relevant to the oscillatory patterns and is in many cases partnered with the sine function. Properties of Sine and Cosine FunctionsSome of the properties of sine and cosine functions are as follows:
How to Graph Sine and Cosine Functions?Graphing sine and cosine functions involves several steps to accurately represent their oscillatory behaviour. Identifying Key Components
Graphing Sine FunctionsTo graph y = sin(x) Identify the amplitude, period, phase shift, and vertical shift. Plot the key points: Start from the origin, and identify maximum, minimum, and intercept points based on the period. Draw the curve: Smoothly connect the points to form a wave.
For example, for y = 2sin (x-π/2) + 1
Graphing Cosine FunctionsTo graph y = cos(x) Identify the amplitude, period, phase shift, and vertical shift. Plot the key points: Start from the maximum value, identify the minimum, and intercept points based on the period. Draw the curve: Smoothly connect the points to form a wave.
For example, for y = 3cos (2x+π) – 2
Graphing Techniques and TipsVarious techniques for graphing sine and cosine functions are: Using a Graphing Calculator
Tips for accurately plotting the graphs:
Manual Graphing
Common Mistakes to AvoidSome mistakes to avoid while graphing sine and cosine function are:
ConclusionSine and cosine functions are the key ideas of calculus, which are used to describe oscillation in many scientific disciplines. Students are not a stranger with functions like these and with an understanding of their properties as well as techniques in graphing them, they can represent them in the best way possible. It presents a systematic methodology for graphing, the most important aspects to bear in mind, and the most frequent mistakes to be avoided to get a concise and orderly plot of sine and cosine functions. FAQs on Graphing of Sine and Cosine FunctionsWhat features are unique to sine and cosine graphs?
In what ways can the graphs of sine and cosine be transformed?
Are sine and cosine graphs continuous?
What are the origins of sine and cosine graphs?
Are sine and cosine odd functions?
|

Reffered: https://www.geeksforgeeks.org
| Mathematics |
| Related |
|---|
| |
| |
| |
| |
| |
Type: | Geek |
Category: | Coding |
Sub Category: | Tutorial |
Uploaded by: | Admin |
Views: | 25 |