|
Creating a chart tooltip that displays dates in the DateTime format can significantly enhance the user experience by providing precise and meaningful information. Whether you are using Chart.js, Highcharts, CanvasJS, or other charting libraries, the process involves configuring the tooltip to format the date correctly. This article will guide you through the steps to create a chart tooltip with the DateTime format using various popular charting libraries.
A chart tooltip is an interactive element that provides additional information about a data point when a user hovers over or clicks on it. Tooltips enhance the user experience by offering context-sensitive details without cluttering the chart.
- Tooltips display supplementary information about a specific data point, such as its value, label, or additional metadata.
- They appear dynamically when a user interacts with the chart (e.g., hovering over or clicking a data point).
- Tooltips can be customized to show various types of information and formatted in different ways. For example, you can include dates, percentages, or custom text.
- They are typically hidden by default and only become visible when the user interacts with the chart. This keeps the chart clean and focused.
Displaying dates in tooltips is crucial for time-series data, where understanding the exact date and time of data points is essential. Proper DateTime formatting ensures that the information is clear and correctly interpreted by users.
Let’s implement Step-by-Step:
Step 1: Choose Your Charting LibraryFirst, you need to choose a charting library that supports tooltips. There are many libraries available, such as –
- Chart.js
- D3.js
- Highcharts
- Plotly
Note: For this example, we will use D3.js, which is a simple yet powerful JavaScript library for creating interactive charts.
Let’s check the project directory structure for clarification.
 Project Directory Step 2: Set Up the EnvironmentBefore we start coding, make sure we have a basic HTML file(e.g., index.html) set up.
HTML
<!DOCTYPE html>
<html lang="en">
<head>
    <meta charset="UTF-8">
    <meta name="viewport" content="width=device-width, initial-scale=1.0">
    <title>Chart Tooltip Example</title>
    <link rel="stylesheet" href="d3js/style.css">
    <script src="https://d3js.org/d3.v7.min.js"></script>
</head>
<body>
    <h1>D3.js Tooltip Example</h1>
    <svg width="500" height="300"></svg>
    <div class="tooltip" style="opacity:0;"></div>
    <script src="d3js/d3.js"></script>
</body>
</html>
Step 3: Add the CSSAdd the file in “style.css”.
CSS
body {
    font-family: Arial, sans-serif;
    display: flex;
    flex-direction: column;
    align-items: center;
    justify-content: center;
    height: 100vh;
    margin: 0;
}

svg {
    max-width: 100%;
}

.tooltip {
    position: absolute;
    text-align: center;
    width: 100px;
    height: 50px;
    padding: 2px;
    font: 12px sans-serif;
    background: lightsteelblue;
    border: 0px;
    border-radius: 8px;
    pointer-events: none;
}
Step 4: Prepare the Data- Create a separate JavaScript file (e.g., d3.js) where we will write the code for the chart.
- Next, we need some data to plot on our chart. For this example, we’ll use a simple dataset with dates and values.
JavaScript
const data = [
    { date: new Date('2024-07-01'), value: 10 },
    { date: new Date('2024-07-02'), value: 20 },
    { date: new Date('2024-07-03'), value: 15 },
    { date: new Date('2024-07-04'), value: 25 },
    { date: new Date('2024-07-05'), value: 30 }
];
Step 5: Create the ChartNow, let’s create the chart using Chart.js (add this code into the script.js file). We’ll configure it to display the date in the tooltip.
JavaScript
const margin = { top: 10, right: 30, bottom: 30, left: 40 },
    width = 460 - margin.left - margin.right,
    height = 400 - margin.top - margin.bottom;

const svg = d3.select("svg")
    .append("g")
    .attr("transform",
          "translate(" + margin.left + "," + margin.top + ")");

const x = d3.scaleTime()
    .domain(d3.extent(data, function(d) { return d.date; }))
    .range([ 0, width ]);
svg.append("g")
    .attr("transform", "translate(0," + height + ")")
    .call(d3.axisBottom(x));

const y = d3.scaleLinear()
    .domain([0, d3.max(data, function(d) { return d.value; })])
    .range([ height, 0 ]);
svg.append("g")
    .call(d3.axisLeft(y));

svg.append("path")
    .datum(data)
    .attr("fill", "none")
    .attr("stroke", "steelblue")
    .attr("stroke-width", 1.5)
    .attr("d", d3.line()
        .x(function(d) { return x(d.date) })
        .y(function(d) { return y(d.value) })
    );

const tooltip = d3.select(".tooltip");

svg.selectAll("dot")
    .data(data)
    .enter()
    .append("circle")
    .attr("cx", function(d) { return x(d.date) })
    .attr("cy", function(d) { return y(d.value) })
    .attr("r", 5)
    .on("mouseover", function(event, d) {
        tooltip.transition()
            .duration(200)
            .style("opacity", .9);
        tooltip.html(d.date.toDateString() + "<br/>" + d.value)
            .style("left", (event.pageX + 5) + "px")
            .style("top", (event.pageY - 28) + "px");
    })
    .on("mouseout", function(d) {
        tooltip.transition()
            .duration(500)
            .style("opacity", 0);
    });
Output:
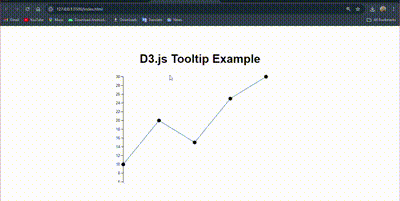 Chart Tooltips with DateTime Format Troubleshooting Tips for D3.js VisualizationsThis guide provides a step-by-step approach to debugging and ensuring your D3.js visualizations work correctly. It covers common issues related to code, data formatting, SVG elements, scales, data binding, CSS styles, library inclusion, data joins, event handlers, and transitions.
- Open the browser’s developer tools and look at the console for any error messages that might indicate issues with your code or data.
- Verify that your data is in the correct format and matches the structure expected by your D3 code (e.g., dates as Date objects).
- Make sure your SVG element has the correct width and height. Use console.log() to debug the dimensions if necessary.
- Ensure that your scales (x, y) are correctly defined and mapped to the data. Use console.log() to check the scale outputs.
- Use console.log() to check that data is properly bound to elements (.data() method).
- Ensure that CSS styles for tooltips and SVG elements are correctly applied and not causing unexpected behavior.
- Make sure the D3.js library is correctly included and loaded in your project. Check the <script> tag and its source URL.
- Ensure that you are updating the elements correctly in the D3 data join (.enter(), .update(), .exit() patterns).
- Verify that event handlers (e.g., mouseover, mouseout) are properly attached and functioning.
- If transitions are not working as expected, check the duration and styles applied during the transition.
Tooltips play a crucial role in data visualization by offering additional information to users. This section highlights the primary use cases for tooltips, including displaying exact values, presenting specific dates or time periods, providing extra details, and offering real-time feedback to enhance user engagement.
- Showing the exact value of a data point, such as a sales amount or temperature reading.
- Presenting specific dates or time periods in time series charts.
- Providing extra details like categories, names, or other metrics associated with the data point.
- Offering real-time feedback or explanations about the data to enhance user engagement.
ConclusionAdding tooltips to the charts is a great way to make our data more engaging and useful. Tooltips help by showing extra details, like dates, when we hover over parts of the chart. This makes it easier to understand the data, especially for time-related information. Whether we use Chart.js, D3.js, or another tool, the basic steps for setting up our chart, preparing our data, and customizing tooltips are similar. By following these steps and troubleshooting tips, we can create charts that are both informative and interactive.
How do I choose the right charting library for my project?Consider factors such as the complexity of your chart, required features, ease of use, and the level of customization needed. Chart.js is great for straightforward charts, while D3.js offers more flexibility and customization.
Dates should be in JavaScript Date objects or ISO date strings. Ensure they are correctly parsed and formatted in your dataset.
Check for common issues like incorrect data bindings, CSS conflicts, or missing event handlers. Use browser developer tools to debug and inspect elements.
Yes, most libraries allow extensive customization. You can adjust the tooltip’s styling through CSS or library-specific options to match your design preferences.
Optimize data processing and rendering by reducing the amount of data or simplifying chart elements. For D3.js, consider using more efficient data joins and updates.
Ensure your CSS styles for tooltips are responsive and that the tooltip’s positioning is adjusted according to screen size. Test on various devices to ensure proper functionality.
|