|
Creating a manual legend in R can be a crucial step in making your plots more understandable, especially when dealing with complex data visualizations. This article will guide you through the process of constructing a manual legend for a complicated plot in R, focusing on both base R and ggplot2 functionalities.
Adding a Legend in Base RLegends are essential for interpreting plots as they provide context by explaining the symbols, colors, and lines used in the visualization. In R, legends can be added using the legend() function in base R or various functions in ggplot2
The legend() function in base R is the primary tool for adding legends to plots. Here is a breakdown of its syntax and usage:
legend(x, y, legend, fill, col, bg, lty, cex, title, text.font)
Where,
- x, y: Coordinates to position the legend.
- legend: Text labels for the legend.
- fill: Colors to fill the legend boxes.
- col: Colors of lines or points.
- bg: Background color of the legend box.
- lty: Line type for lines in the legend.
- cex: Text size.
- title: Title of the legend.
- text.font: Font style of the legend text.
Adding a Simple LegendFirst we will start with Adding a Simple Legend.
R
# Create data
x <- 1:10
y1 <- x^2
y2 <- 2 * y1

# Plot data
plot(x, y1, type = "b", pch = 19, col = "red", xlab = "X", ylab = "Y")
lines(x, y2, type = "b", pch = 18, col = "blue", lty = 2)

# Add legend
legend("topright", legend = c("Line 1", "Line 2"), col = c("red", "blue"),
       lty = 1:2, cex = 0.8)
Output:
 Construct a Manual Legend for a Complicated Plot in R Creating a Manual Legend in ggplot2In ggplot2, legends are automatically generated based on the aesthetics mappings. However, you can manually customize legends using functions like scale_color_manual() and guides(). Customizing Legends with ggplot2:
R
library(ggplot2)

df <- data.frame(
  x = c(1, 2, 2, 3, 5, 6, 8, 8, 9, 9, 10, 11, 12, 15, 15),
  y = c(2, 3, 3, 4, 5, 5, 6, 7, 8, 8, 9, 10, 16, 19, 28)
)

# Create plot with custom legend
ggplot(df, aes(x, y)) +
  geom_point() +
  geom_smooth(se = FALSE, aes(color = 'Linear')) +
  geom_smooth(formula = y ~ poly(x, 2), se = FALSE, aes(color = 'Quadratic')) +
  geom_smooth(formula = y ~ poly(x, 3), se = FALSE, aes(color = 'Cubic')) +
  scale_color_manual(
    name = 'Regression Model',
    breaks = c('Linear', 'Quadratic', 'Cubic'),
    values = c('Cubic' = 'pink', 'Quadratic' = 'blue', 'Linear' = 'purple')
  ) +
  theme(legend.title = element_text(size = 20), legend.text = element_text(size = 14))
Output:
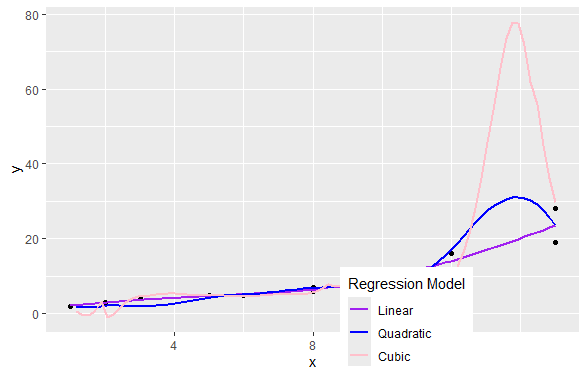
 Construct a Manual Legend for a Complicated Plot in R Advanced Customizations in ggplot2 by Changing Legend PositionYou can place the legend inside the plot area or outside using theme():
R
ggplot(df, aes(x, y)) +
  geom_point() +
  geom_smooth(se = FALSE, aes(color = 'Linear')) +
  geom_smooth(formula = y ~ poly(x, 2), se = FALSE, aes(color = 'Quadratic')) +
  geom_smooth(formula = y ~ poly(x, 3), se = FALSE, aes(color = 'Cubic')) +
  scale_color_manual(
    name = 'Regression Model',
    breaks = c('Linear', 'Quadratic', 'Cubic'),
    values = c('Cubic' = 'pink', 'Quadratic' = 'blue', 'Linear' = 'purple')
  ) +
  theme(
    legend.position = c(0.8, 0.2),
    legend.justification = c("right", "top"),
    legend.box.just = "right",
    legend.margin = margin(6, 6, 6, 6)
  )
Output:
 Construct a Manual Legend for a Complicated Plot in R Customizing Legend AppearanceYou can control the appearance of the legend box, keys, and text:
R
ggplot(df, aes(x, y)) +
  geom_point() +
  geom_smooth(se = FALSE, aes(color = 'Linear')) +
  geom_smooth(formula = y ~ poly(x, 2), se = FALSE, aes(color = 'Quadratic')) +
  geom_smooth(formula = y ~ poly(x, 3), se = FALSE, aes(color = 'Cubic')) +
  scale_color_manual(
    name = 'Regression Model',
    breaks = c('Linear', 'Quadratic', 'Cubic'),
    values = c('Cubic' = 'pink', 'Quadratic' = 'blue', 'Linear' = 'purple')
  ) +
  theme(
    legend.box.background = element_rect(color = "red", size = 2),
    legend.box.margin = margin(6, 6, 6, 6),
    legend.key = element_rect(fill = "white"),
    legend.text = element_text(color = "blue", size = 12),
    legend.title = element_text(face = "bold", size = 14)
  )
Output:
 Construct a Manual Legend for a Complicated Plot in R ConclusionConstructing a manual legend for a complicated plot in R requires understanding the various customization options available in both base R and ggplot2. By mastering these techniques, you can create clear and informative plots that effectively communicate your data’s story.
|