|
|
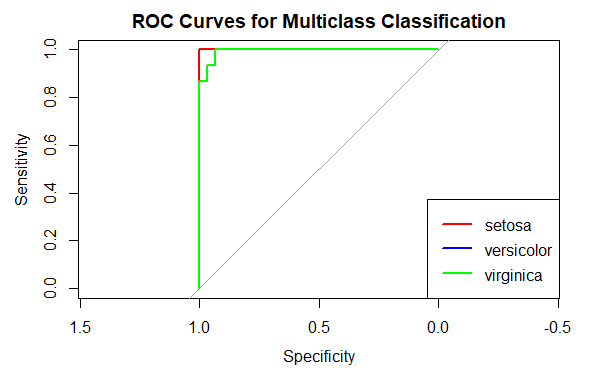
Receiver Operating Characteristic (ROC) curves are a powerful tool for evaluating the performance of classification models. While ROC curves are straightforward for binary classification, extending them to multiclass classification presents additional challenges. In this article, we’ll explore how to generate and interpret ROC curves for multiclass classification using R Programming Langauge. Understanding ROC CurvesROC curves plot the True Positive Rate (TPR) against the False Positive Rate (FPR) at various threshold settings. The Area Under the Curve (AUC) summarizes the ROC curve’s information, with values closer to 1 indicating better model performance. Multiclass ROC CurvesFor multiclass classification, there are a few common approaches to extending ROC curves:
We’ll use the pROC and multiclass.roc libraries to implement ROC curves for multiclass classification. Step 1: Installing and Loading Necessary LibrariesFirst we will Installing and Loading Necessary Libraries. Step 2: Preparing the DataFor demonstration purposes, we’ll use the famous Step 3: Train a Multiclass ClassifierWe’ll train a Support Vector Machine (SVM) model using the Step 4: Calculate ROC CurvesWe’ll calculate the ROC curves using the One-vs-Rest (OvR) approach. For each class, we create a binary problem and calculate the ROC curve. Output: ROC Curves for Multiclass Classification in R ConclusionROC curves are an essential tool for evaluating the performance of classifiers. In multiclass classification, the One-vs-Rest approach is commonly used to calculate ROC curves and AUC scores for each class. By following the steps outlined in this article, you can effectively create and visualize ROC curves for multiclass classification in R using the |
Reffered: https://www.geeksforgeeks.org
| AI ML DS |
Type: | Geek |
Category: | Coding |
Sub Category: | Tutorial |
Uploaded by: | Admin |
Views: | 18 |