|
|
Visualizing neural network models is a crucial step in understanding their architecture, debugging, and conveying their design. PyTorch, a popular deep learning framework, offers several tools and libraries that facilitate model visualization. This article will guide you through the process of visualizing a PyTorch model using two powerful libraries: torchsummary and torchviz. Prerequisites Before we dive into model visualization, ensure you have the following prerequisites:
Refer to the link : How to Print the Model Summary in PyTorch Table of Content Visualizing the Model ArchitectureVisualizing the architecture of a neural network can help you understand its structure and the flow of data through its layers. Visualizing neural networks can help you:
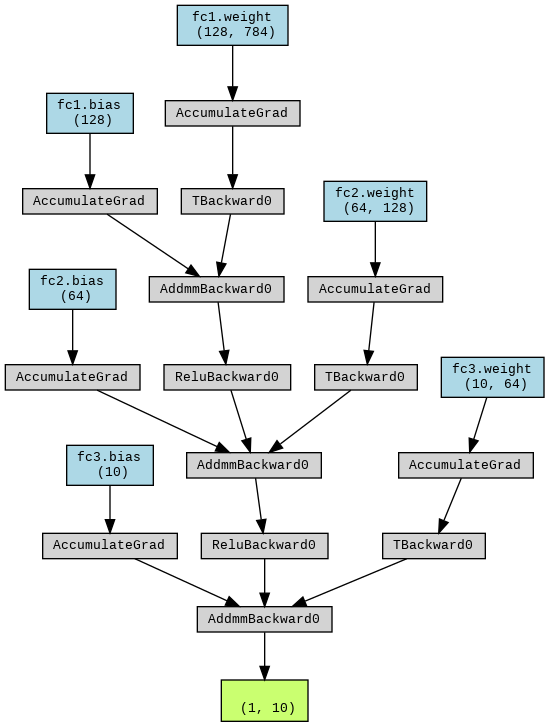
PyTorch provides several libraries and tools to visualize neural networks, including Torchviz, Netron, and TensorBoard. These tools can generate graphical representations of the model architecture, track training metrics, and visualize activations and gradients. Building a Simple Neural Network in PyTorchBefore diving into visualization techniques, let’s first build a simple neural network using PyTorch. This code defines a simple feed-forward neural network with three fully connected layers. Now, let’s explore different visualization techniques. Visualization Techniques for Neural Network in Pytorch1. TorchvizTorchviz is a library that provides a way to visualize the computational graph of a PyTorch model. Installation !pip install torchvizUsage This code generates a graphical representation of the model’s computational graph and saves it as a PNG file. Output: Torchviz 2. TensorBoardTensorBoard is a visualization toolkit for machine learning experiments. It can be used to visualize the model architecture, training metrics, and more. Installation !pip install tensorboardUsage First, set up TensorBoard in your PyTorch code: Then, launch TensorBoard within the Python environment: Output: 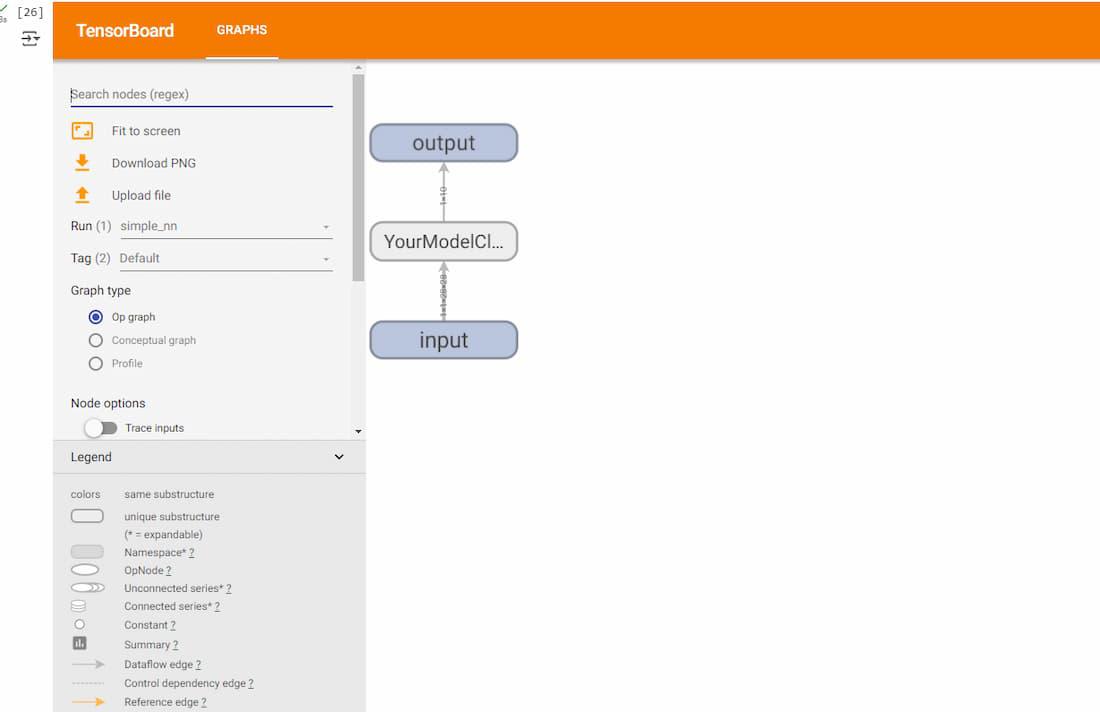 launched TensorBoard Best Practices for Visualizing Neural Networks in PyTorch1. Visualize Intermediate LayersUnderstanding how data flows through intermediate layers can help diagnose issues like vanishing gradients or identify which features are being extracted at different stages. Use hooks in PyTorch to capture and visualize activations from intermediate layers. def hook_fn(module, input, output): 2. Regularly Monitor Training MetricsUse TensorBoard to log and monitor metrics such as loss and accuracy during training. This helps in identifying overfitting, underfitting, and other training issues. for epoch in range(num_epochs): 3. Visualize Feature MapsFeature maps provide insights into what each convolutional layer is learning. This is particularly useful for convolutional neural networks (CNNs) def visualize_feature_maps(model, input_image): 4. Debug GradientsVisualizing gradients can help in understanding how the model is learning and identifying issues like vanishing or exploding gradients. Tools like Weights & Biases can be used for this purpose. import wandb ConclusionVisualizing neural networks in PyTorch is essential for understanding and debugging models. This article covered several techniques, including Torchviz, Netron, TensorBoard, saliency maps, and class activation maps. These tools provide valuable insights into the model’s architecture and performance, making it easier to develop and optimize deep learning models. |
Reffered: https://www.geeksforgeeks.org
| AI ML DS |
Type: | Geek |
Category: | Coding |
Sub Category: | Tutorial |
Uploaded by: | Admin |
Views: | 20 |