|
|
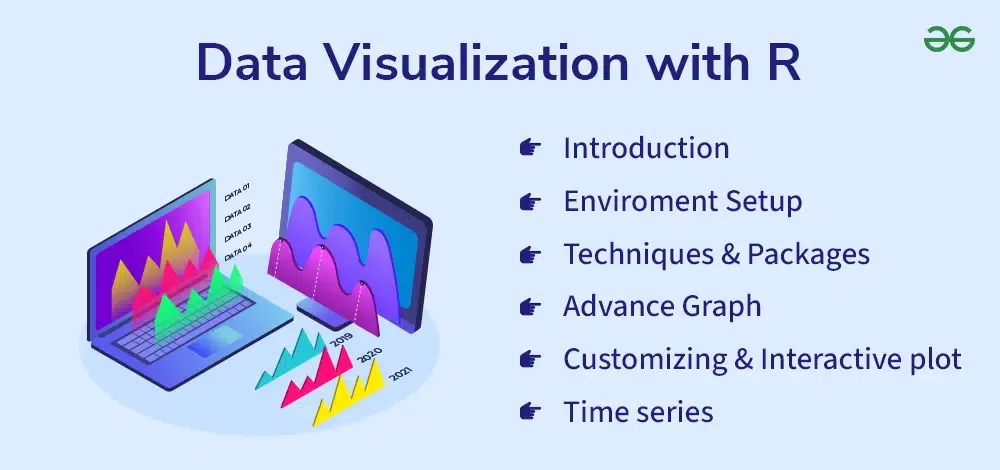
In R Programming Language you have a wide range of tools and packages to create stunning visualizations, allowing you to unlock insights and communicate your findings effectively. data visualization with R is like turning raw data into a work of art that helps you understand the story behind the numbers. It’s a powerful tool for anyone who works with data.  Data visualization with R Table of Content
Introduction to Data VisualizationLearn the basics of turning data into visual representations, making it easier to understand and analyze patterns and trends. Setting Up Your EnvironmentData visualization involves installing software such as R, a statistical programming language, and its associated packages. These packages provide additional functionalities and tools for creating various types of visualizations. Basic Data Visualization TechniquesHere are some types of plots are available to visualize your data and gain insights quickly. These techniques are used to explore relationships, trends, and patterns within data sets, making it easier for viewers to understand and interpret the information presented.
Advanced Graph TypesFor more complex visualization types such as heatmaps, treemaps, and network graphs for a richer understanding of your data.
Overview of Visualization PackagesIn R Programming Language various tools and libraries available for creating visualizations, each with its strengths and specialties.
Customizing Plots with ggplot2Use the ggplot2 package to customize the appearance and style of your plots, making them more visually appealing and informative.
Interactive Data Visualization with ShinyShiny package allows you to create interactive visualizations where users can explore the data themselves.
Geospatial Data VisualizationUnderstand how to visualize data on maps, representing geographical information effectively using R’s geospatial packages.
Time Series VisualizationDive into techniques for visualizing data that changes over time, such as stock prices or weather patterns, to identify trends and patterns.
Handling Large DatasetsLearn strategies for visualizing large and complex datasets efficiently, including techniques like data aggregation and sampling.
Combining VisualizationsDiscover how to combine multiple visualizations into one single place allowing you to tell a more complete story with your data.
Case StudiesExplore real-world examples of data visualization projects, learning from successful implementations to improve your own skills.
FAQ – Data visualization with R1. Why should I learn data visualization with R?
2. What are the basic data visualization tools in R?
3. What is ggplot2 and why is it popular?
4. How do I get started with ggplot2?
5. What are some advanced data visualization techniques in R?
|
Reffered: https://www.geeksforgeeks.org
| AI ML DS |
Type: | Geek |
Category: | Coding |
Sub Category: | Tutorial |
Uploaded by: | Admin |
Views: | 14 |