
|
|
Matplotlib, a powerful Python library for creating high-quality 2D and 3D plots, offers a wide range of customization options for axis ticks. One common requirement is to turn on minor ticks only on the y-axis. This article will delve into the methods and techniques to achieve this specific customization. Table of Content Understanding Axis Ticks in MatplotlibBefore diving into the customization, it is essential to understand the basics of axis ticks in Matplotlib. Axis ticks are the markers on the axes that indicate specific values. There are two types of ticks: major ticks and minor ticks. Major ticks are typically larger and have labels, while minor ticks are smaller and often do not have labels. By default, Matplotlib uses major ticks, but minor ticks can be added for more detailed information. Major and Minor Ticks:
Locator and Formatter Objects:The locations and labels of ticks are controlled by locator and formatter objects. Locator objects determine the positions of the ticks, while formatter objects handle the formatting of the tick labels. For example, in a logarithmic plot, the locator object might be a Default Behavior of Minor TicksBy default, when you use the minorticks_on function to turn on minor ticks, they appear on both the x and y axes. This can be seen in the following code snippet: Output: Default Behavior of Minor Ticks Turning on Minor Ticks Only on the Y-Axis1. Using tick_paramsTo turn on minor ticks only on the y-axis, you need to use the tick_params method. This method allows you to customize the appearance of ticks on a specific axis. Here is how you can do it: In this code, plt.gca().tick_params(axis=’x’, which=’minor’, bottom=False) is used to turn off minor ticks on the x-axis. The minorticks_on function is then used to turn on minor ticks globally, but since they are turned off on the x-axis, they will only appear on the y-axis. 2. Using MultipleLocatorAnother way to achieve this is by using the MultipleLocator class from the matplotlib.ticker module. This class allows you to specify the locations of minor ticks manually. Here is how you can use it: Output: 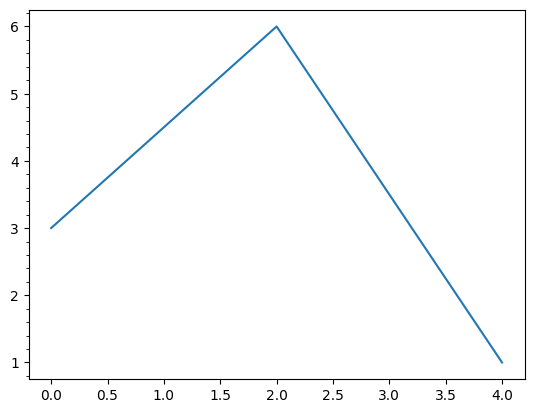 Using MultipleLocator Customizing Tick Appearance in MatplotlibIn addition to controlling the presence of minor ticks, you can also customize their appearance using the tick_params method. For example, you can change the color, width, and length of minor ticks: 1. Adding Color, Changing Length and WidthOutput: 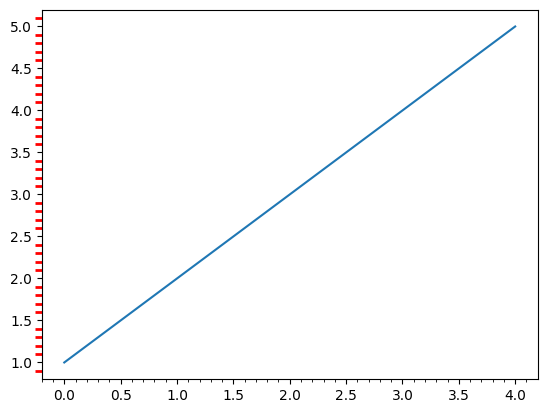 Customizing Tick Appearance in Matplotlib 2. Setting Minor Tick LocationsYou can use the Output:  Setting Minor Tick Locations 3. Formatting Minor Tick LabelsTo format minor tick labels, use the Output:  Formatting Minor Tick Labels ConclusionCustomizing ticks in Matplotlib enhances the readability and precision of your plots. This article provided a comprehensive guide on how to turn on minor ticks only on the y-axis, along with advanced customization options. By following these steps, you can create more informative and visually appealing plots. |
Reffered: https://www.geeksforgeeks.org
| AI ML DS |
Type: | Geek |
Category: | Coding |
Sub Category: | Tutorial |
Uploaded by: | Admin |
Views: | 18 |