
|
|
Reactive applications are designed to be responsive, resilient, elastic, and message-driven. Monitoring and logging are the crucial aspects of maintaining and troubleshooting these applications. They can provide insights into the application performance, help detect issues early, and ensure smooth operation. This article explores how to set up the monitoring and logging for the reactive applications using Spring Boot and related tools. Monitoring Reactive ApplicationsMonitoring reactive applications can involve tracking the various performance metrics such as response times, error rates, throughput, and resource utilization. Tools like Spring Boot Actuator, Micrometer, and Prometheus are commonly used for monitoring reactive applications. Key Points:
Logging in Reactive ApplicationsLogging can be essential for the understanding application behavior, debugging and tracking the issues. Reactive applications, being the non-blocking and synchronous, require the logging approach that can handle the high throughput and concurrent operations efficiently. Tools like Logback, SLF4J and Elastic Stack (ELK) are often used for the logging in the reactive applications. Key Points:
Implementation of Monitoring and Logging for Reactive ApplicationsStep 1: Create the Spring Boot ProjectCreate a new Spring Boot Project using IntelliJ Idea and choose the following options:
Refer the below image for better understanding to create the project. Step 2: Add the DependenciesAdd the following dependencies into the project.  Dependencies: <dependencies>
<dependency>
<groupId>org.springframework.boot</groupId>
<artifactId>spring-boot-starter-actuator</artifactId>
</dependency>
<dependency>
<groupId>org.springframework.boot</groupId>
<artifactId>spring-boot-starter-webflux</artifactId>
</dependency>
<dependency>
<groupId>io.micrometer</groupId>
<artifactId>micrometer-tracing-bridge-brave</artifactId>
</dependency>
<dependency>
<groupId>org.springframework.boot</groupId>
<artifactId>spring-boot-devtools</artifactId>
<scope>runtime</scope>
<optional>true</optional>
</dependency>
<dependency>
<groupId>io.micrometer</groupId>
<artifactId>micrometer-registry-prometheus</artifactId>
<scope>runtime</scope>
</dependency>
<dependency>
<groupId>org.projectlombok</groupId>
<artifactId>lombok</artifactId>
<optional>true</optional>
</dependency>
<dependency>
<groupId>org.springframework.boot</groupId>
<artifactId>spring-boot-starter-test</artifactId>
<scope>test</scope>
</dependency>
<dependency>
<groupId>io.projectreactor</groupId>
<artifactId>reactor-test</artifactId>
<scope>test</scope>
</dependency>
</dependencies>
After creating the project, the file structure will look like the below image. 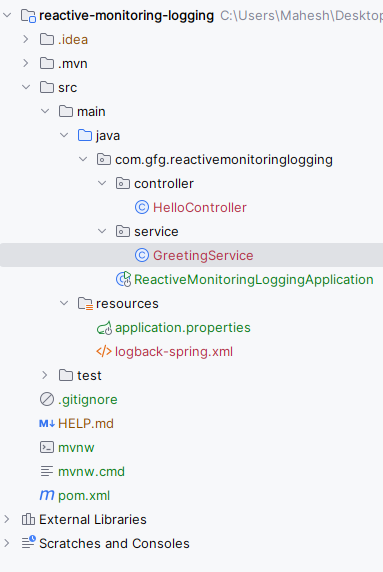 Step 3: Configure Application PropertiesOpen the # Enable all Actuator endpoints
management.endpoints.web.exposure.include=*
# Configure Micrometer to use Prometheus
management.metrics.export.prometheus.enabled=true
management.metrics.export.prometheus.endpoint=/prometheus
# Application port
server.port=8080Step 4: Create the logback-spring.xml fileGo to src > main > resources > logback-spring.xml and and create a logback-spring.xml. Step 5: Create GreetingService ClassGo to src > main > java > com.gfg.reactivemonitoringlogging > service > GreetingService and put the below code. The GreetingService class is a Spring service that provides a reactive method getGreeting(), which returns a Mono containing the string “Hello, Reactive World!”. This allows for non-blocking, asynchronous operations within reactive applications. Step 6: Create the HelloController ClassGo to src > main > java > com.gfg.reactivemonitoringlogging > controller > HelloController and put the below code. The HelloController class is a REST controller in a Spring application that handles GET requests to the /hello endpoint. It uses dependency injection to inject an instance of GreetingService. The sayHello() method invokes getGreeting() from GreetingService, returning a reactive Mono<String> that asynchronously provides the greeting “Hello, Reactive World!”. This ensures non-blocking, reactive handling of requests. Step 7: Main ClassNo changes are required in the main class pom.xml:Step 8: Run the ApplicationStart the application on port 8080. .jpg) Step 9: Testing the EndpointsHealth Endpoint: http://localhost:8080/actuator/healthOutput: Metrics endpoint: http://localhost:8080/actuator/prometheusOutput: Hello Endpoint: http://localhost:8080/helloOutput: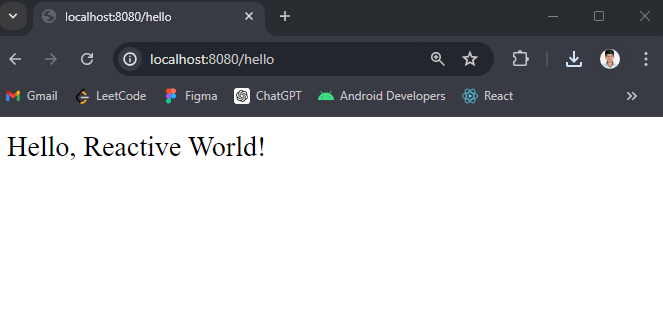 By the following this example project, we can set up the reactive application with monitoring and logging the capabilities using the Spring Boot, Micrometer, Prometheus and Logback of the Spring Application. |
Reffered: https://www.geeksforgeeks.org
| Advance Java |
Type: | Geek |
Category: | Coding |
Sub Category: | Tutorial |
Uploaded by: | Admin |
Views: | 17 |