|
|
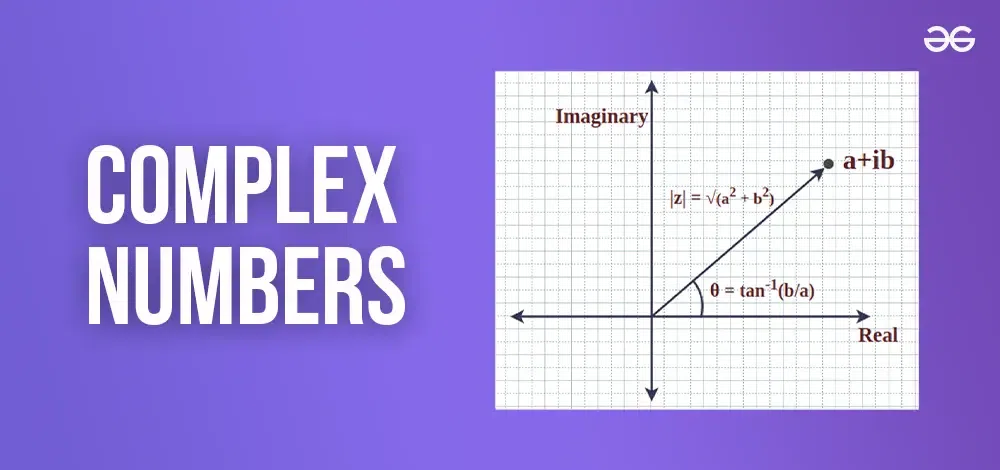
Graphing complex numbers is an interesting aspect of mathematics that combines algebra and geometry to provide a visual representation of complex equations. Graphing complex numbers is an effective way of providing a graphical representation of complex numbers which are unique mathematical entities. The complex numbers that contain real and imaginary parts are drawn by complex planes similar to two-dimensional Cartesian planes. By Plotting complex numbers, we can see their relationships and interactions, enhancing comprehension and practical problem-solving skills. This article defines the methods and significance of graphing complex numbers ( plotting complex numbers on graph) on the complex plane, also illustrates how the real and imaginary components come together to form a complete picture. Table of Content What Are Complex Numbers?Complex numbers are numbers that consist of two parts: a real part and an imaginary part. Complex numbers extend the idea of one-dimensional real numbers to the two-dimensional complex plane, allowing for the solution of equations that have no real solutions. They are used in various fields such as engineering, physics, and applied mathematics to model and solve problems involving oscillations, waves, and other phenomena that cannot be adequately described using only real numbers. Complex Numbers A complex number z is defined as:
where,
In this notation, a is called the real part of z (denoted as R(z)), and b is called the imaginary part (denoted as I(z)). Thus, for a complex number z:
Properties of Complex NumbersThe basic properties of complex numbers are as follows:
Graphing Complex NumbersComplex number can be plotted on a graph in two ways that includes:
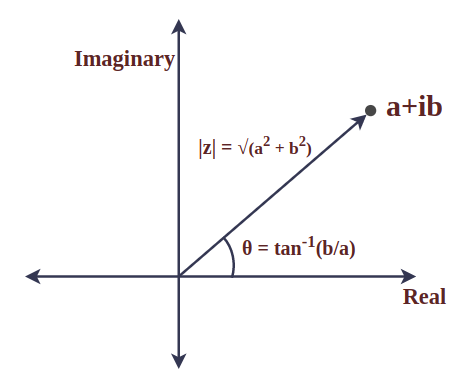
Cartesian Representation of Complex NumbersThe Cartesian form of complex numbers enables, the complex numbers to be represented on a two-dimensional plane whose coordinates are normally referred to as the real axis and the imaginary axis. Plotting Complex Numbers on Complex PlaneComplex plane is one of the planes that comprise two dimensions whereby each complex number has its point in the plane. The x-axis or the horizontal axis is called the real axis here it shows the real value of the number whereas the y-axis or vertical axis is known as the imaginary axis which shows the imaginary part of the number. For a complex number z = a + bi:
 Plotting Complex Numbers on Complex Plane Steps to Plot Complex Numbers
Plot Multiple Numbers: Repeat the above steps for additional complex numbers to visualize their relationships. Polar Representation of Complex NumbersPolar representation of complex numbers on the graph involves expressing such numbers in terms of their magnitude and angle of orientation with the positive real axis as another form of coordinate system. Conversion Between Cartesian and Polar FormThe conversion between Cartesian form [Tex]z = a + bi[/Tex] and polar form [Tex]z = r(cosθ + isinθ)[/Tex] involves the following formulas: From Cartesian to Polar:
From Polar to Cartesian:
Example: Given [Tex]z = 3 + 4i[/Tex]: [Tex]r = \sqrt{3^2 + 4^2} = 5 \\ \theta = \tan^{-1}\left(\frac{4}{3}\right) \approx 53.13^\circ[/Tex] Plotting Complex Numbers in Polar CoordinatesDetermine Magnitude and Angle: Compute the magnitude r and angle θ. Plot the Point: From the origin, measure the angle θ counterclockwise and mark the point at distance r. 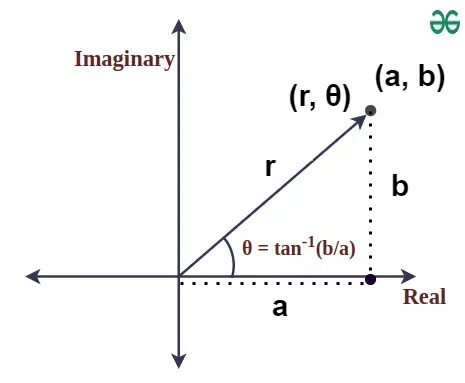 Plotting Complex Numbers in Polar Coordinates Example : Plot the complex numbers Z1 = 5 + 3i on Graph.Example : Plot the complex numbers Z2 = 5(cos60∘ +isin60∘) on Graph.Operations on Complex PlanePerforming calculations on complex numbers is as easy as moving points on the complex plane and thus eases the understanding of their algebraic transformations. Example on Addition and Subtraction of complex numberGraphical Interpretation: Adding or subtracting complex numbers corresponds to vector addition or subtraction on the complex plane. Example: For z1 = 3+4i and z2 = 1+2i: [Tex]z_1 + z_2~=~(3 + 1) + (4 + 2)i~=~4 + 6i\\ z_1 – z_2~=~(3 – 1) + (4 – 2)i~=~~2 + 2i[/Tex] Example on Multiplication and Division of complex numberPolar Form Multiplication: Multiplying complex numbers in polar form involves multiplying their magnitudes and adding their angles. [Tex]z_1 \cdot z_2 = r_1 r_2 \left( \cos(\theta_1 + \theta_2) + i \sin(\theta_1 + \theta_2) \right)[/Tex] Polar Form Division: Dividing complex numbers involves dividing their magnitudes and subtracting their angles. [Tex]\frac{z_1}{z_2} = \frac{r_1}{r_2} \left( \cos(\theta_1 – \theta_2) + i \sin(\theta_1 – \theta_2) \right)[/Tex] Example: Given z1 = 5(cos45∘ +isin45°) and z2 = 2(cos30∘ +isin30∘) perform multiplication and division of z1 and z2.
Read More: Applications of Graphing Complex NumbersThe applications of Graphing Complex numbers are as follows:
ConclusionUnderstanding and graphing complex numbers provide deep insights into various mathematical and real-world applications. Through Cartesian and polar representations, complex numbers can be visually analyzed, facilitating operations and comprehension. These concepts are indispensable in fields such as engineering, physics, and signal processing, highlighting the importance of mastering complex number graphing techniques. Graphing Complex Numbers- FAQsHow to Plot Complex Number on Complex Plane?
How can Complex Numbers also be Represented?
What is Real Part of Complex Number Plotted on Graph?
|
Reffered: https://www.geeksforgeeks.org
| Mathematics |
Type: | Geek |
Category: | Coding |
Sub Category: | Tutorial |
Uploaded by: | Admin |
Views: | 15 |