|
|
Power BI is the most valuable tool for business/data analytics and has the power to visualize and analyze the data easily and also make informed decisions. In this article, we will cover what is data model in Power BI, relationships in Power BI, how to create relationships in Power BI using the autodetect method and manual method, and editing relationships between tables: cardinality and cross-filter direction. What is a Power BI Data Model?Power BI Data Model is the collection of tables and relationships between them that are used to create reports and visualizations. It allows you to organize and analyze your data efficiently and also involves defining relationships between tables and creating calculated columns and measures. Data Model in Power BI has a major impact on the performance of reports and visualizations. With the help of data models in Power BI, we can make complex, insightful visuals and reports with refined data. In Power BI most of the time we work with data models from multiple tables that must be connected to relationships. Some of the key points of the Power BI data model are tables, relationships, data analysis expression(DAX), and creating calculations and measures. Simply, it is the logical representation of how the data is structured. It is the collection of relationships and tables between them in which we can create reports and visuals. Power BI Model RelationshipsIn Power BI, model relationships define how the tables are linked. In model relationships, you can create effective and insightful data visualization for easy understanding. There are different types of relationships:-
The following tips can help to create efficient data model relationships:
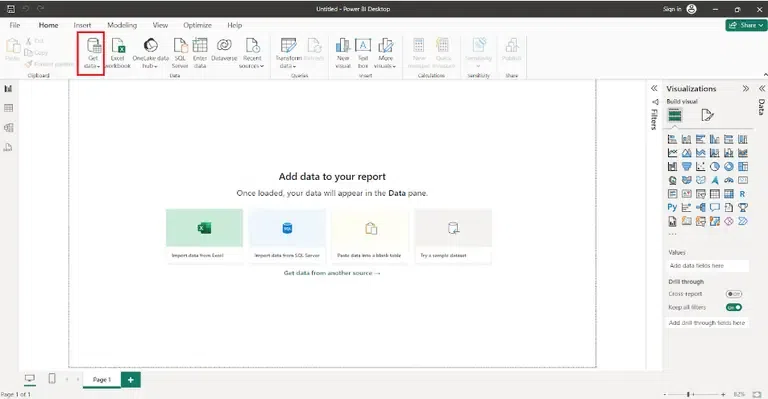
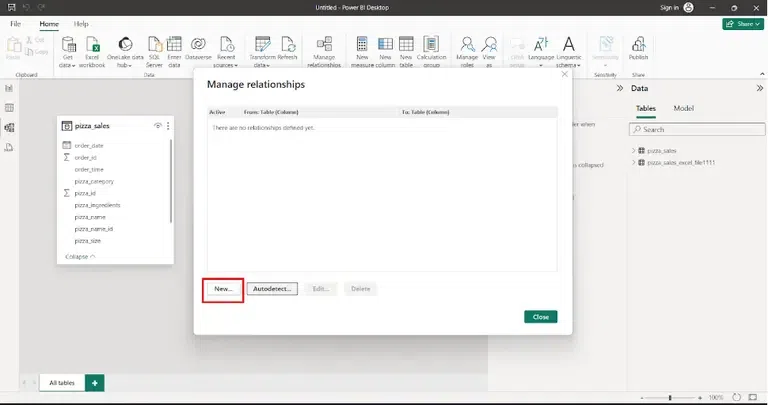
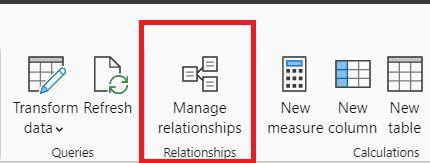
How to Create Relationship in Power BI?Creating relationships in Power BI is a fundamental step in building a data model. As relationships define how tables are connected to each other. With the help of these, you can easily analyze and visualize data from multiple tables. Power BI offers both autodetect and manual for establishing relationships. The autodetect method simplifies the process by identifiying and creating relationships based on fields with identical names in different tables. If they want to control and customize, they can switch to manual methods. They can manually create relationships, specifying the tables and relationships such as one-to-one, one-to-many, many-to-one, many-to-many. Create a relationship with autodetectBy using auto-detect feature while creating a relationship, users can establish relationships between tables based on field name and interconnected to data model for report and analyze. Steps-by-Steps guidelines are: Step 1: Load your Data using the “Home” tab and select “Get Data”. Get Data Step 2: On the modeling view, Go to the “Manage Relationship”. 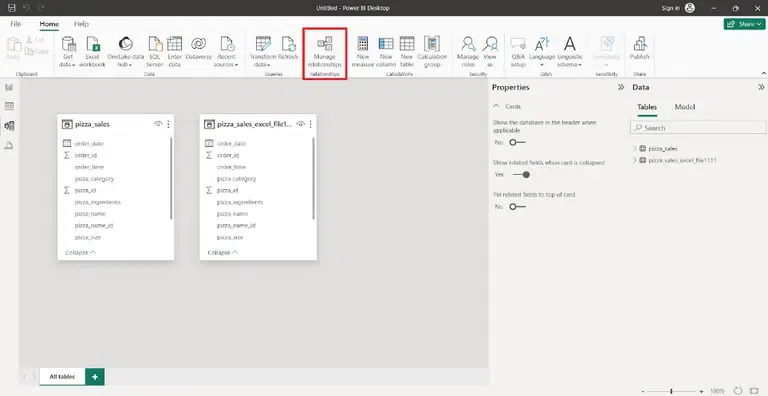 Manage Relationship Step 3: Select “Autodetect” option. Step 4: Then select the “OK” option. 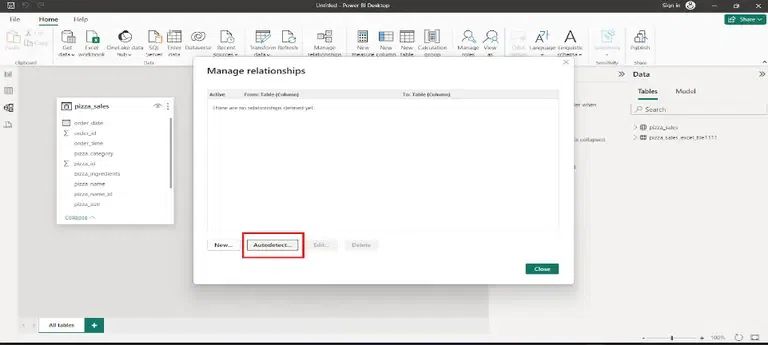 Autodetect Relationship Create a relationship manuallyIn Power BI, users can create table relationships manually. Cardinality and cross-filter direction are automatically set during creation but users can edit them as required. By manually creating relationships in Power BI, users have greater control and are able to customize the relationships between two tables that are interconnected to each other. Steps-by-Steps guidelines are: Step-1: Load your Data using the “Home” tab and select “Get Data”. Get Data Step-2: On the modeling view, go to the “Manage Relationship”. Manage Relationship Step-3: Select “New” option.
 Manual Relationship Edit a RelationshipsTable relationships in Power BI can be edited using different methods: Diagram View
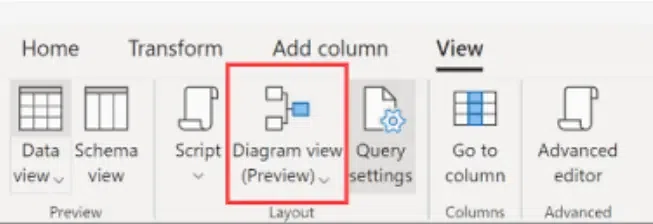 Diagram View Manage Relationships
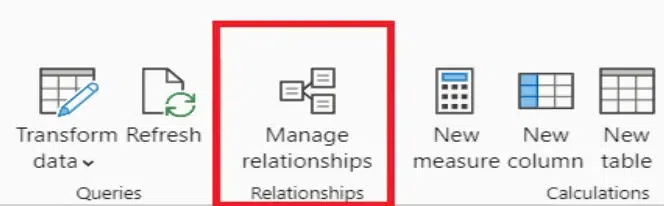 Manage Relationship Data View
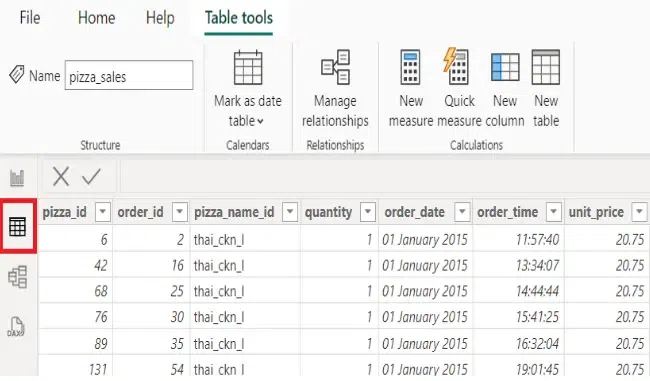 Data View in Power Bi Configure More OptionsOnce your tables are interconnected with each other it is very important to edit relationships in power bi. Editing a relationship in power bi adjusting the properties of an existing relationship or modifying the relationships type. Here, we’ll examine two aspects.
CardinalityIn power bi, cardinality plays an important role in defining the nature of relationships between tables within a data model. It specifies how the rows in the first table connected to the rows in the second table. There are four cardinality types: One-to-One Relationships, One-to-Many Relationships, Many-to-One Relationships and Many-to-Many Relationships.
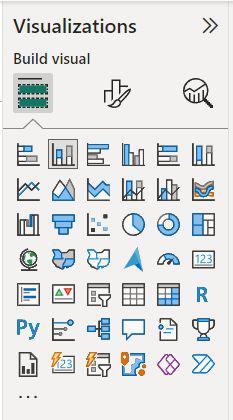
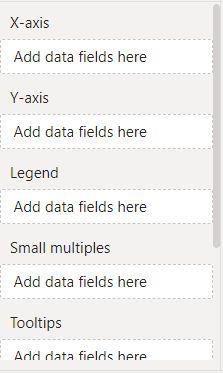
When creating and editing relationships in power bi, choosing an appropriate cardinality is very important for data analysis and reporting. By understanding and setting cardinality correctly, users can navigate seamlessly across related tables. Cross-filter directionIn power bi, every power bi model relationship is called cross-filter direction. Cross-filter directions dependent on cardinality type like Single and Both cross-filter direction type will be applied as One-to-Many or many-to-One cardinality type, Both cross-filter type will applied as One-to-One cardinality type and Single (Table1 to Table2), Single (Table2 to Table1), Both cross-filter type will applied as Many-to-Many cardinality type. Building Data ModelsBy following these steps, we can build data models in Power Bi 1. Import Data: Connect to data sources and import relevant datasets into Power BI. 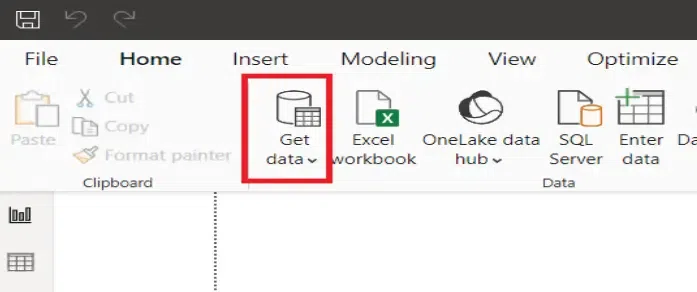 Get Data 2. Transform Data: Use Power Query Editor to clean, transform, and shape data as needed. 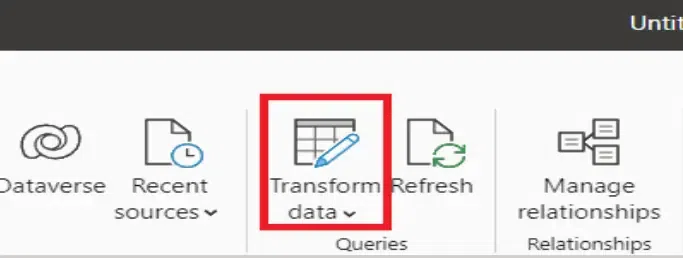 Transform data 3. Create Relationships: Define relationships between tables based on common fields. 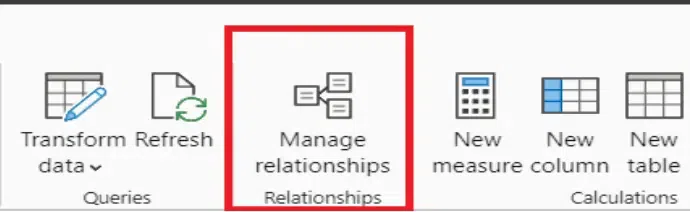 Manage Relationship 4. Build Measures: Use DAX (Data Analysis Expressions) to create custom calculations and measures. 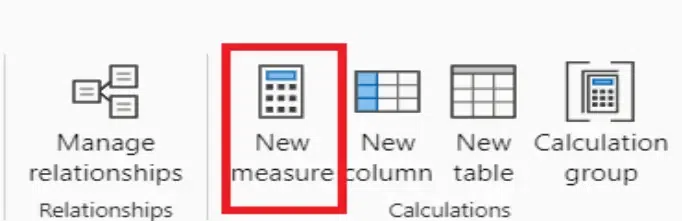 New Measure in Power BI Building VisualizationsTo build visualization in power bi, follow these step- 1. Select Visualizations: Choose the appropriate visualizations (e.g., bar chart, line chart, table) for the type of insights needed.
2. Drag and Drop Fields: Drag and drop fields from the data model onto the appropriate areas of the chosen visualization (e.g., values, axis, legend).
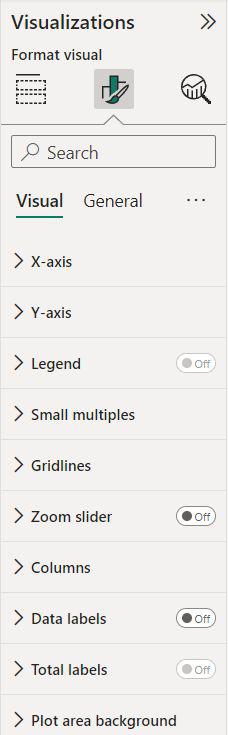
3. Format Visual Elements: Customize visual elements such as colors, fonts, and titles to enhance clarity and aesthetics.
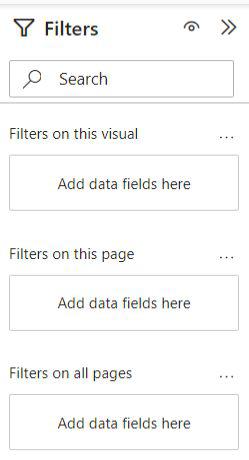
4. Apply Filters: Utilize filters to focus on specific subsets of data within the visualizations.
Interactivity and SlicersSome overview abouts Interactivity and slicers are- 1. Slicers: Slicers are visual filters that allow users to interactively slice and dice data. Users can select specific values or ranges in a slicer, affecting all connected visuals on the report. 2. Custom Interactivity: Advanced users can implement custom interactivity using DAX measures and Power BI’s built-in features. Make This Relationship ActiveBy following steps for making the relationship active are- 1. Open Power BI Desktop: Launch Power BI Desktop and open your Power BI project. 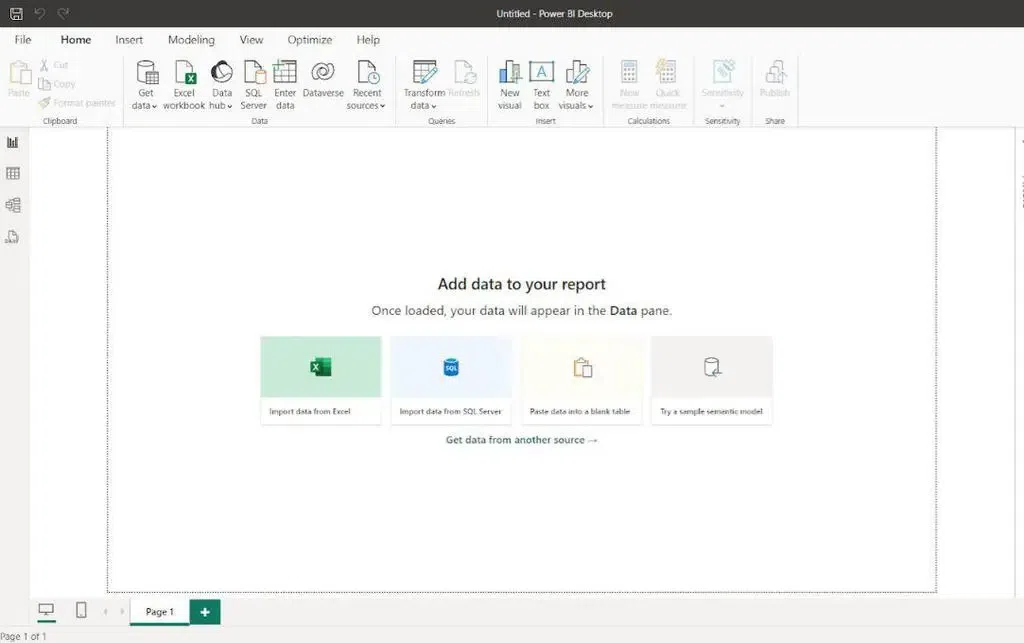 Get Data 2. Navigate to “Relationships” View: Go to the “Model” view by clicking on the “Model” icon on the left side of the screen.
3. Identify the Relationship: Locate the relationship you want to activate between two tables. 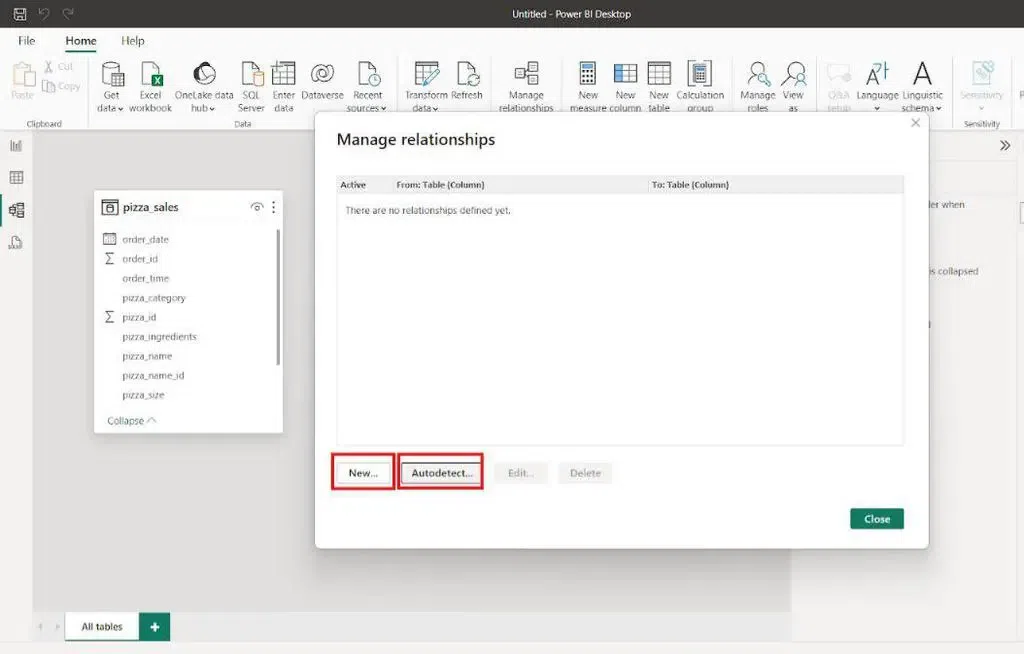 Autodetect Relationship 4. Edit Relationship: Right-click on the relationship line and choose “Edit Relationship” from the context menu. 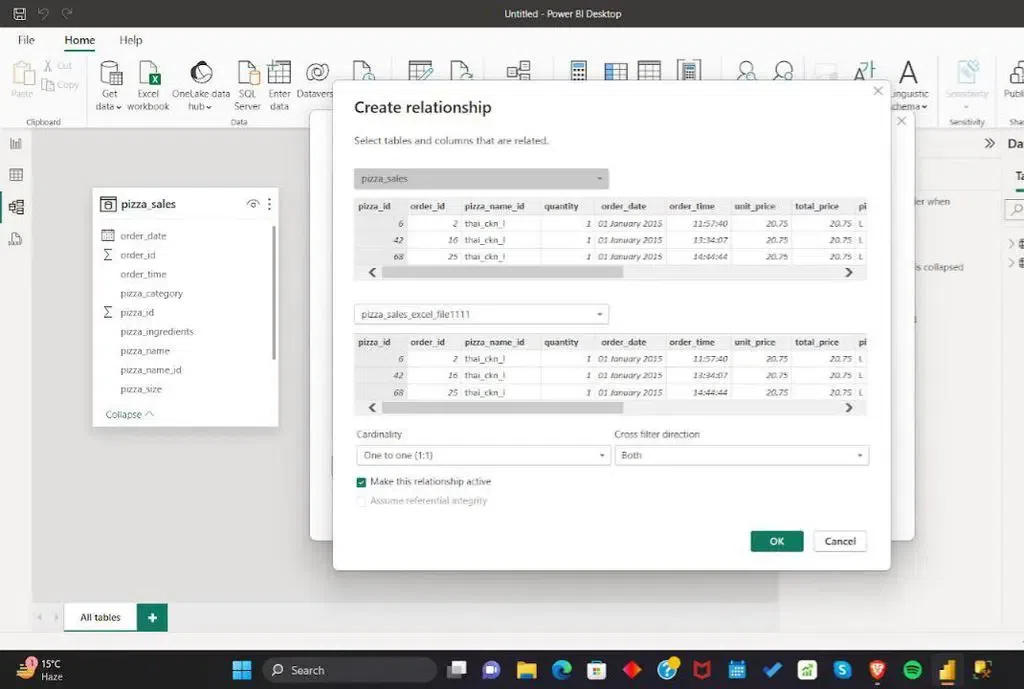 Create Relationship 5. Configure Relationship Options: In the “Edit Relationship” dialog, ensure that the “Active” option is checked. 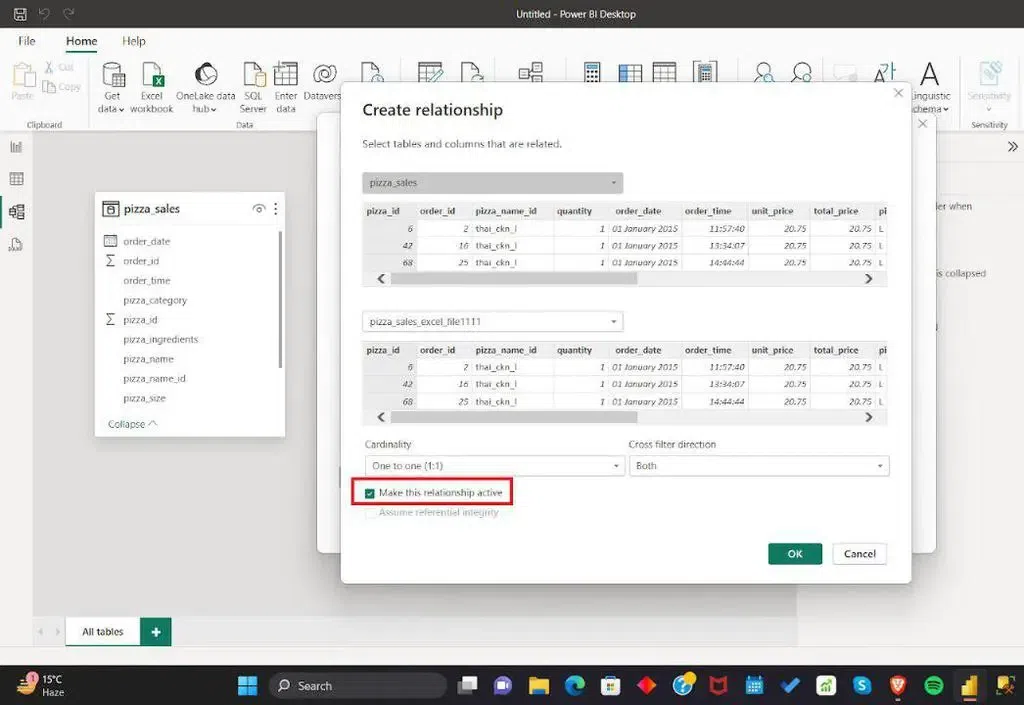 Active Relationship in Power BI ConclusionOverall, in power bi while creating a relationships and data model between tables, you can easily understand the reports and visuals. And also you can work with data if they are in a single table. In the whole summary, you have learnt how to create relationships between tables by using autodetect and manually methods, while working in manually methods you can use cardinality and cross-filter direction, how many types of cardinality and cross-filter are, how to use all the types of cardinality and cross-filter is uses in power bi while making relationships between tables. Frequently Asked Question(FAQs)1. Why is it important to create relationships between tables in Power BI?
2. What is the significance of cardinality in Power BI relationships?
3. What is DAX(Data Analysis Expression) in Power BI?
|
Reffered: https://www.geeksforgeeks.org
| AI ML DS |


Type: | Geek |
Category: | Coding |
Sub Category: | Tutorial |
Uploaded by: | Admin |
Views: | 18 |