|
|
DAX (Data Analysis Expressions) Measures in Power BI are standard aggregation functions or dynamic custom expressions defined with the DAX formula language. Using this formula language, you can calculate, combine, and filter data that can return one or more values. DAX Measures are dynamic and user-defined formulas where results change depending on context. This article discusses the DAX Measures in Power BI, how to create and edit, and how to use them in Power BI Visualization reports. What is DAX?DAX, the Data Analysis Expressions is a powerful formula expression language that includes functions, operators, and constants to perform simple to advanced calculations and queries on data from different data sources to return values. DAX helps to perform complex calculations and analyze data trends in real-world business scenarios. Syntax
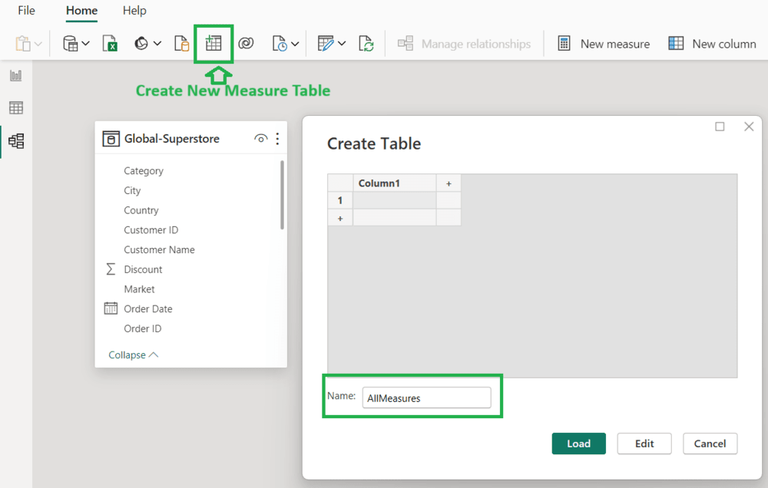
Prerequisites DAX Measures can be created and used from Power BI, so a basic working knowledge of Power BI Desktop is required. Working knowledge of Formulas in Microsoft Excel can be helpful but understanding how a formula is written is essential. Example:1.Maximum Forecast By Country = MAX(Forecast[Forecast]) 2.ProfitOnSales = Sum(‘Order Data'[Revenue]) – SUM(‘Order Data'[Cost]) What is Measure?A measure is a calculation done on data field, which can perform an arithmetic calculations or aggregate functions. In Power BI, measures are used to create variety of DAX functions like SUM, AVERAGE, MAX, MIN and COUNT. Examples: Measures include: Total Sales, Total Salaries, Average Quantity, Average Order Value, Count of Customers, Year-to-Date (YTD) Sales and so on. Measure TableA Measure Table in Power BI is a special table created from Power BI using the Create new Table option and this table is used to store a collection of all DAX Measures created from Power BI. Creating Measure TableTo create a new Measure Table, click ‘Create New Table’ button from the menu bar in ‘Model View’ mode. Give a Table Name and click ‘Load’ button to create a new measure table. DAX Measure Table in Power BI Create New Measure from Measure TableWe can create new measures and add it to the Measure table. Right click on the new measure table to create a New Measure. Below is an example of Measures in a Measure Table and how a new Measure is created with DAX Measure.  Create Measures from Measure Table How to create a DAX Measure in Power BI?1. Open Power BI desktop version 2. Import Data from a Data Source like Excel, SQL Server, Access, Oracle, MySQL or any other data set like XML, JSON, Text File  Get Data Source 3. Once the data source is loaded, the Fields list will be added to the right of the window.  Data Fields in Power BI design window 4. Create a New DAX Measure by clicking the ‘New Measures’ button at the tool bar at the top  Add New Measure 5. Input New Measure Name, default will be ‘Measure’ and add ‘=’ sign  Details of creating a New Measure 6. Add Function Name like Sum, Average, MAX, MIN or any other calculation function and open a bracket ‘(‘. 7. Select the Column name from the list of columns after typing in the table name and close the bracket ‘)’ 8. The new measure is ready. The new measure will be displayed with the fields list.  New Measure added to fields list. 9. Use the Measure to create Visualization in Power BI as below.  DAX Measure used in Power BI Visualization Creating Measures Using AggregateX FunctionsThere are many AggregateX functions for creating DAX measures in Power BI. These functions are used to aggregate values over a table or table expression by performing row-wise calculations. Below are the AggregateX functions available: SUMX, AVERAGEX, COUNTX, MINX and MAXX Syntax:
The AggregateX function will have two arguments, where first is a table name and the second is an expression or calculation on the table columns. Example: AggregateX Demo = SUMX('Global-Superstore','Global-Superstore'[Shipping Cost] - 'Global-Superstore'[Sales])
Below is the list of common Aggregate DAX functions with description:
AggregateX Functions are Iterator FunctionsThe AggregateX Functions like SUMX, AVERAGEX, COUNTX, MINX and MAXX are also called iterator functions. They are useful when we need to make calculations using columns from different related tables. AggregateX Functions are called iterator functions since they evaluate the expression over each row of a table specified. Below is an example for Iteration using AggregateX function: SumOfCookiesabove800 = SUMX('Order Data',IF('Order Data'[Cookies Shipped] > 800,'Order Data'[Cookies Shipped],0))
Creating Calculated Columns Using DAXCalculated columns are new columns created in an existing data table using a DAX Formula. This will be part of the table and can be used in Power BI visualization reports. In Power BI, select the table where you want to create a new calculated column, and click ‘New Column’ button from menu bar. In the DAX formula bar add the new calculation for the new column to be created. A sample of how to create a new calculated column is shown below:  Calculated Column DAX Calculate and Values FunctionsCALCULATE FunctionIn Power BI, the CALCULATE is a fundamental and very useful function. This function is used to evaluate an expression by applying filters, conditions and any calculation based on the context. Syntax: CALCULATE(Expression, [Filter1], ...)
Example: CalculateDEMO = CALCULATE(SUM('Global-Superstore'[Sales]),'Global-Superstore'[Country] = "United States")
Example: CalculateFiltersDemo = CALCULATE(SUM('Global-Superstore'[Sales]),
'Global-Superstore'[Country] = "United States" ||
'Global-Superstore'[Country] = "Germany")
 CALCULATE function VALUES Function:In DAX for Power BI, the VALUES function is used to retrieve distinct values from a column. Syntax: VALUES(TableORColumnName)
Example: Number of cities = COUNTROWS(VALUES(City[CityName]))
Using the FILTER Function in DAXThe Power BI DAX, the FILTER function is used to get data from a table or an expression based on conditions applied. It is generally used in combination with other functions. Syntax: FILTER(Table, Filter OR Condition)
Example: FilterDAX1 = Calculate(Sum(Forecast[Forecast]),FILTER(Forecast, Forecast[Country]="USA" || Forecast[Country]="Italy"))
Variable for DebuggingIn DAX variables can be used to store and reuse value stored in the variable within a formula. The variables in a DAX formula make it more readable, easier to maintain and helps in reusing values store in variables. Below is the Syntax of how a variable is used:
The keyword ‘VAR’ indicates the beginning of the variable declaration. The keyword ‘RETURN’ indicates the beginning of the expression that will return the result. Below is an example of using variables: DiscountOffered = VAR SaleQuantity = SUM('Order Data'[Cookies Shipped])
VAR CostOfCookies=SUM('Order Data'[Cost])
Return IF(SaleQuantity > 800, CostOfCookies * 10/100, SaleQuantity * 5 / 100)
The ‘DiscountOffered’ is a measure created with 2 variables to calculate the discount based on no of cookies shipped using an if condition. The below is the output
DAX StudioDAX Studio is a tool to write, execute, and analyze DAX queries in Power BI. It provides a set of great features to help developers to create, test and optimize DAX formulas. DAX Studio has a Query Editor and option to execute and view results. DAX Studio is integrated with PowerBI and it connects directly with PowerBI mnodels and allows to work seemlessly with PowerBI datasets. To write a Query or calculation in DAX Studio, it starts with ‘EVALUATE’ as in the example below. EVALUATE {SUM('Order Data'[Cost])}
Example of DAX Studio Editor for selecting all rows from a table:
DAX Studio is a downloadable open source tool and the UI looks as above with options to write queries or expression like DAX measures and run then. It has the Result View window at the bottom to review the results. The tool can be connected to different datasources. ConclusionDAX Measures can be used to create calculations using wide range of functions for statistical, mathematical and date-time calculations. Using DAX measures in Power BI, interactive and dynamic reports can be created with Power BI visuals, which support advanced data analytics and business intelligence to gain deeper insights from their data. |


Reffered: https://www.geeksforgeeks.org
| Geeks Premier League |
Type: | Geek |
Category: | Coding |
Sub Category: | Tutorial |
Uploaded by: | Admin |
Views: | 12 |