Horje
Multiplot Command in Gnuplot

Gnuplot is a portable, free, command-driven, interactive function, and data plotting program for Linux, OS/2, MS Windows, OSX, VMS, and many other platforms. Although copyrighted, the source code is freely available. It was initially developed to enable researchers and students to interactively visualize mathematical functions and data, but it has since expanded to cover a wide range of non-interactive purposes, including web scripting. Third-party programs like Octave also use it as a plotting engine. Numerous plot types are supported by Gnuplot in both 2D and 3D. It can draw utilizing a variety of associated text as well as lines, points, boxes, contours, vector fields, and surfaces. Additionally, it supports a number of specialty plot kinds. Gnuplot provides output in a variety of file formats like eps, emf, fig, jpeg, LaTeX, pdf, png, postscript, etc.

Installation:

  • Download Gnuplot software from here.
  • Double-click the downloaded executable file.
  • Follow the instructions on the installation wizard to install Gnuplot.
  • After successful installation, start Gnuplot and a screen like this will appear.
Gnuplot


Multiplot Command in Gnuplot

When Gnuplot is in the multiplot mode, which is initiated with the command “set multiplot,” multiple plots are displayed on the same page or window. On some terminals, the entire page is drawn when the command “unset multiplot” is used before Gnuplot returns to its default single-plot mode and shows the plot. For other terminals, every different plot command updates the display, either by simply adding the new plot to the one that already exists or by completely redoing the display while also adding the new plot.
Before creating the new plot, the area that will be used by the following plot is not removed. If desired, as is frequently the case with “inset” plots, the clear command can be used to accomplish this.

Syntax:

 set multiplot { layout <rows>,<cols>
                    {rowsfirst|columnsfirst} {downwards|upwards}
                    {title <page title>}
                    {scale <xscale>{,<yscale>}} {offset <xoff>{,<yoff>}}
                  }
    unset multiplot

In some cases, no plot is displayed until the command unset multiplot is given. This command causes the entire page to be drawn and then returns the Gnuplot to its normal single-plot mode. 

set xrange, yrange commands are used to specify the range in which the graph is to be plotted.

set xlabel, ylabel commands are used to label the axes.

set title is used to name the graph

Example 1: Plotting of a few curves using the multiplot command.

set xrange[0:100]
set yrange[0:100]
set xlabel “X”
set ylabel “Y”
set title “Functions”
set multiplot layout 2,2 columns
plot 1+x t “1+x”
plot 1+x*x t “1+x^2”
plot 1+x*x*x t “1+x^3”
plot 1+x*x*x*x t “1+x^4”
unset multiplot

Explanation:

  • “set title” can be added after “set multiplot” which will then name each and every graph individually.
  • set multiplot layout sets the layout in which the graphs are to be placed. In the example above 2,2 column refers to 2 graphs in 2 columns i.e, 4 graphs in total.
  • We can also change the plot style of the graph by using the command “with” when plotting.

Output:

Multiplot 1


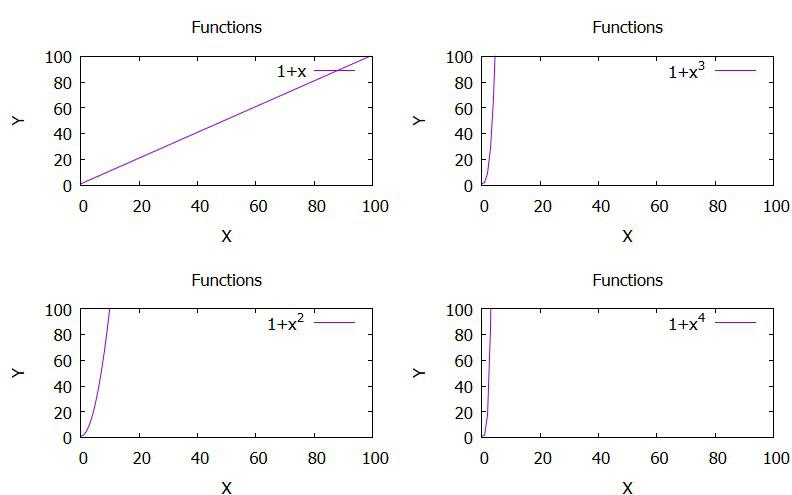
Example 2: Plotting of a few trigonometric curves using the multiplot command.

set xrange[0:2]                    
set yrange[0:2]                    
set xlabel “X”                     
set ylabel “Y”                     
f(x) = sin(x)                      
g(x) = cos(x)          
set title “Trigonometric functions”
set multiplot layout 1,2 columns   
plot f(x) w lp t “Sine”            
plot g(x) w lp t “Cosine”          
unset multiplot                    

Explanation:

“set multiplot layout 1,2 columns  ” means 1 row including 2 plots.

Output:

Multiplot 2


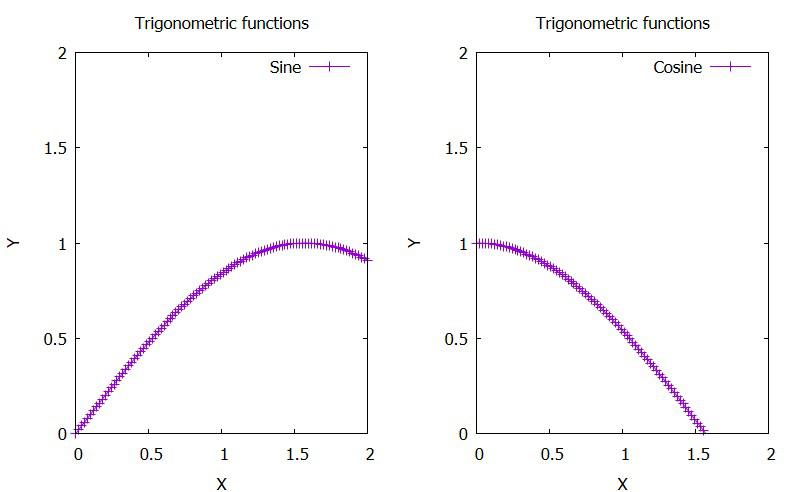
Reffered: https://www.geeksforgeeks.org


Engineering Mathematics

Related
Partial Differential Equation | Definition, Formula, Type &amp; Examples of PDE Partial Differential Equation | Definition, Formula, Type &amp; Examples of PDE
Complex Integration Complex Integration
Functions in Discrete Mathematics Functions in Discrete Mathematics
Problem Solving on Scatter Matrix | Engineering Mathematics Problem Solving on Scatter Matrix | Engineering Mathematics
What is the Basel Problem? Engineering Mathematics What is the Basel Problem? Engineering Mathematics

Type:
Geek
Category:
Coding
Sub Category:
Tutorial
Uploaded by:
Admin
Views:
18