|
|
We know how to formulate equations of different degree, and it is used a lot in real life, but the question arises, is it always possible to convert a situation into an equation? Sometimes we get statements like, the number of Covid cases per day in Delhi has reached more than 10,000. This phrase “Less than”, “Greater than”, “less than or equal to” etc. Such phrases are difficult to translate into equations. For such cases, we need to learn how to make equations with inequalities in them. Let’s see this in detail. What are Inequalities?Let’s consider an example, Anil wants to buy some cold drinks. Each cold drink costs Rs 20, and he has a total of Rs 190 with him. Suppose he buys x cold drinks. What can be the maximum value of x? It can be represented in the form of an equation given below, 20x < 190
Some general examples of the inequalities are, ax + by + c > 0 ….(1) ax + by + c < 0 ….(2) ax + by + c ≥ 0 ….(3) ax + by + c ≤ 0 ….(4)
From the above equations, equations (1) and (2) are called strict inequalities, and (3) and (4) are called slack inequalities. Solutions of InequalitiesAny solution to an inequality is the value of that variable which makes inequality a true statement. For example, suppose we have an inequality x < 5. In such a case, all the values of x which are less than 5 make this inequality a true inequality. While solving inequalities we need to keep some rules in mind,
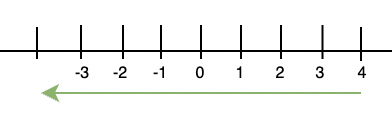
These operations do not affect the inequality and can be used to simplify the inequality for us. Question: Solve the inequality 20x < 80 and show its solutions on a graph. >Solution:
Graphical Representations of Inequalities in Two VariablesWe saw the graph of a linear inequality in one variable. A linear equation in two variables represents a line that divides the plane into two parts. We call each part a half-plane. If the line is vertical, it will divide the plane into the left half-plane and the right half-plane and the non-vertical line divide the plane into the upper left half-plane and lower half-plane. 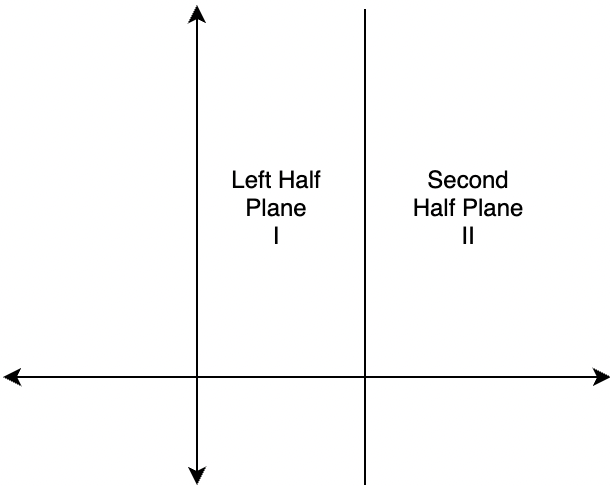  Any point in the Cartesian plane will either lie on the line or on either of the half-planes I and II. Let’s say we have a line, ax + by = c Here, a ≠ 0 and b ≠ 0. Now when we put any point (x, y) in the equation, there are three possible cases:
Let’s see all the cases Case (i): ax + by > c
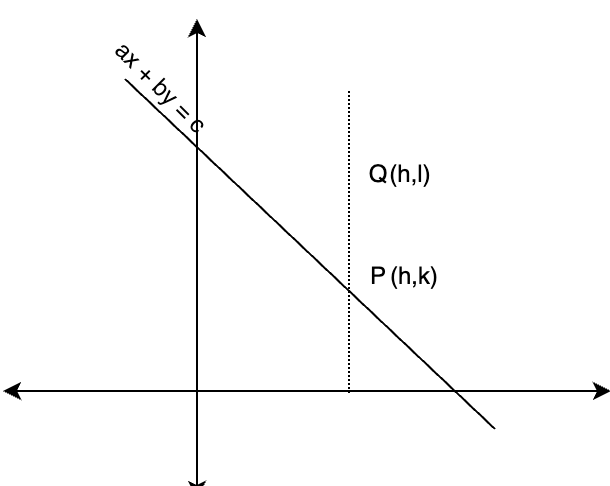 Taking another arbitrary point (h, l). The figure below represents the two points along with the line. We know,
Thus, point (h, l) satisfy the property ax + by > c. Thus, all the points lying in half-plane II satisfy this inequality. For b < 0 also, this can be proved similarly. Case (ii): ax + by = c
Case (iii): ax + by < c
Let’s see some problems with these concepts. Also, Check
Sample ProblemsQuestion 1: Solve the equation 5x + 3y > 6 graphically. Solution:
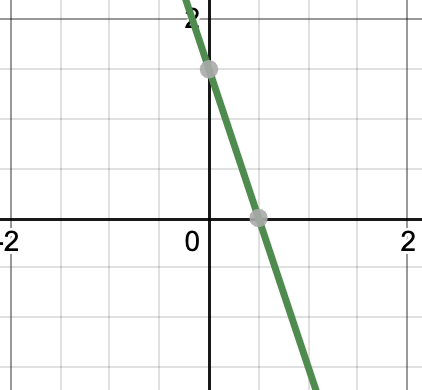
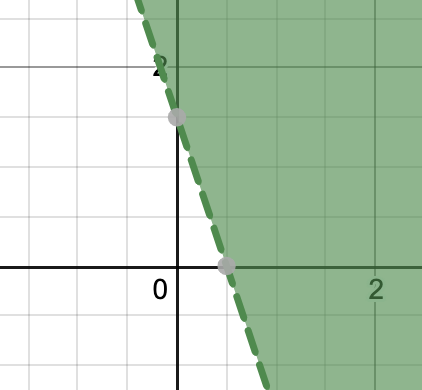
Question 2: Solve the equation 6x + 2y > 3 graphically. Solution:
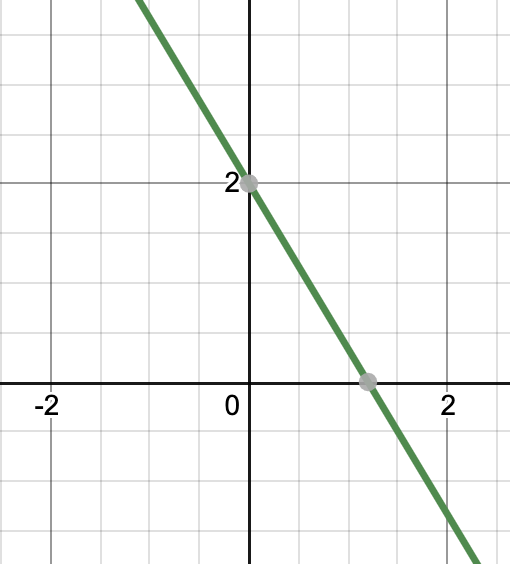
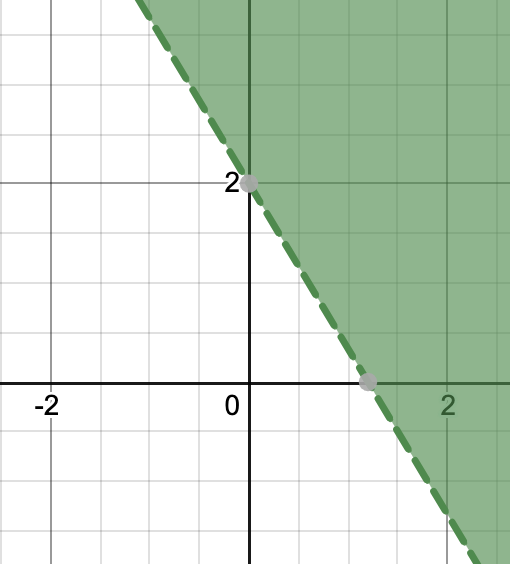
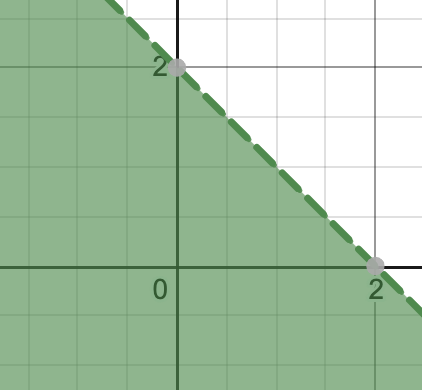
Question 3: Solve the equation x + y < 2 graphically. Solution:
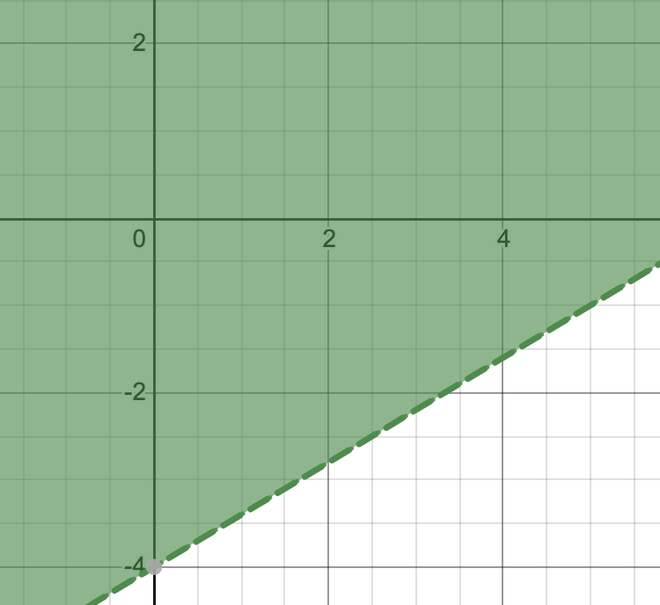
Question 4: Solve the equation 3x – 5y < 20 graphically. Solution:
Question 5: Form the inequality from the graph given below. 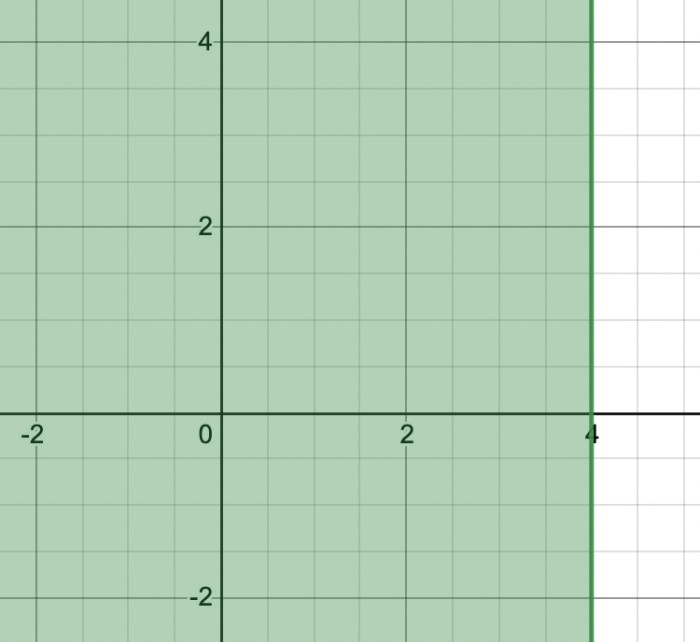 Solution:
Question 6: Form the inequality from the graph given below. 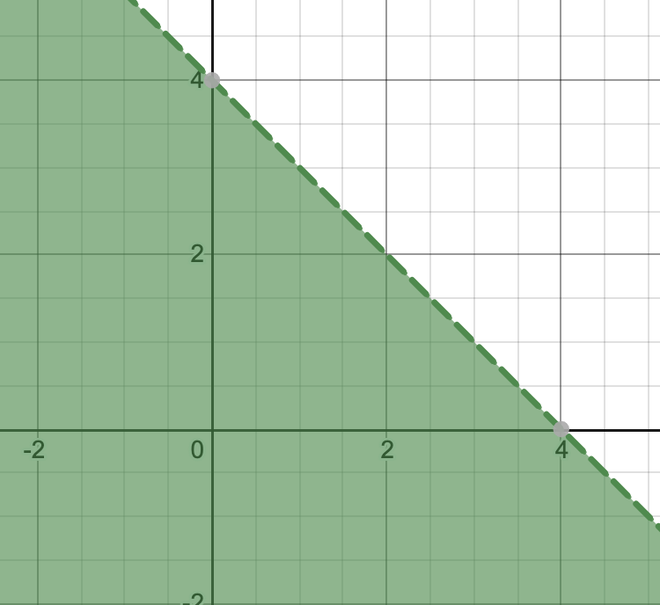 Solution:
Practice Problems1. Solve the equation 2x – 4y < 20 graphically. 2. Solve the equation y≤2x+1 graphically. 3. Solve the equation y>−1/2x+3 graphically. 4. Solve the equation 2x−3y≤6 graphically. 5. Solve the equation −x+4y<8 graphically. 6. Solve the equation x+y≥4 graphically. 7. Solve the equation x−2y>−4 graphically. ConclusionThe graphical solution of linear inequalities in two variables involves representing the solution set on a coordinate plane. This process begins by converting the inequality into an equation to identify the boundary line. Depending on whether the inequality is strict (using < or >) or non-strict (using ≤ or ≥), the boundary line is drawn either as a dashed line or a solid line, respectively. Next, a test point, often (0,0) unless it lies on the boundary, is selected to determine which side of the line satisfies the inequality. The region that fulfills the inequality is then shaded, indicating all the possible solutions. This graphical representation provides a visual understanding of the solution set, making it easier to analyze and interpret the relationships between the variables. FAQs on Graphical Solution of Linear Inequalities in Two VariablesWhat is a linear inequality?
What is linear inequality in two variables
What is the graphical solution of linear inequality in two variables?
How to graph linear inequalities?
|
Reffered: https://www.geeksforgeeks.org
| Class 11 |


Type: | Geek |
Category: | Coding |
Sub Category: | Tutorial |
Uploaded by: | Admin |
Views: | 8 |