
|
|
Sampling distribution is essential in various aspects of real life. Sampling distributions are important for inferential statistics. A sampling distribution represents the distribution of a statistic, like the mean or standard deviation, which is calculated from multiple samples of a population. It shows how these statistics vary across different samples drawn from the same population. In this article, we will discuss the Sampling Distribution in detail and its types along with examples and go through some practice questions too. Table of Content What is Sampling Distribution?Sampling distribution is also known as a finite-sample distribution. Sampling distribution is the probability distribution of a statistic based on random samples of a given population. It represents the distribution of frequencies on how spread apart various outcomes will be for a specific population. Since population is too large to analyze, you can select a smaller group and repeatedly sample or analyze them. The gathered data, or statistic, is used to calculate the likely occurrence, or probability, of an event. Important Terminologies in Sampling DistributionSome important terminologies related to sampling distribution are given below:
Understanding Sampling DistributionSampling distribution of a statistic is the distribution of all possible values taken by the statistic when all possible samples of a fixed size n are taken from the population. Each random sample that is selected may have a different value assigned to the statistics being studied. Sampling distribution of a statistic is the probability distribution of that statistic. Factors Influencing Sampling DistributionA sampling distribution’s variability can be measured either by calculating the standard deviation(also called the standard error of the mean), or by calculating the population variance. The one to be chosen is depending on the context and interferences you want to draw. They both measure the spread of data points in relation to the mean. 3 main factors influencing the variability of a sampling distribution are:
Types of DistributionsThere are 3 main types of sampling distributions are:
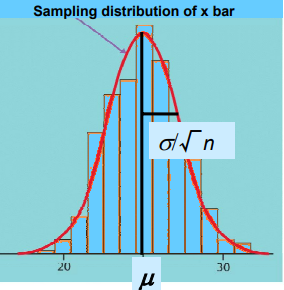
Sampling Distribution of MeanMean is the most common type of sampling distribution. It focuses on calculating the mean or rather the average of every sample group chosen from the population and plotting the data points. The graph shows a normal distribution where the center is the mean of the sampling distribution, which represents the mean of the entire population. We take many random samples of a given size n from a population with mean µ and standard deviation σ. Some sample means will be above the population mean µ and some will be below, making up the sampling distribution. For any population with mean µ and standard deviation σ:
There is no tendency for a sample mean to fall systematically above or below µ, even if the distribution of the raw data is skewed. Thus, the mean of the sampling distribution is an unbiased estimate of the population mean µ. 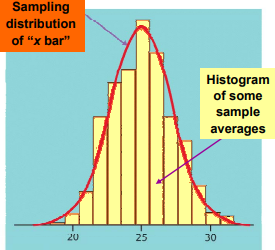 Sampling distribution of the sample mean
Sampling Distribution of ProportionSampling distribution of proportion focuses on proportions in a population. Here, you select samples and calculate their corresponding proportions. The means of the sample proportions from each group represent the proportion of the entire population.  Sampling distribution of proportion – 1 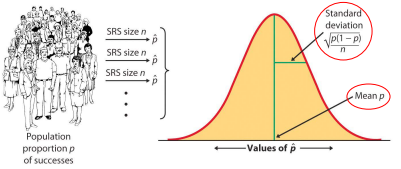 Sampling distribution of proportion – 2 Formula for the sampling distribution of a proportion (often denoted as p̂) is:
where:
This formula calculates the proportion of occurrences of a certain event (e.g., success, positive outcome) within a sample. T-DistributionSampling distribution involves a small population or a population about which you don’t know much. It is used to estimate the mean of the population and other statistics such as confidence intervals, statistical differences and linear regression. T-distribution uses a t-score to evaluate data that wouldn’t be appropriate for a normal distribution. Formula for the t-score, denoted as t, is:
where:
This formula calculates the difference between the sample mean and the population mean, scaled by the standard error of the sample mean. The t-score helps to assess whether the observed difference between the sample and population means is statistically significant. Central Limit Theorem[CLT]Central Limit Theorem is the most important theorem of Statistics.  Central Limit Theorem According to the central limit theorem, if X1, X2, …, Xn is a random sample of size n taken from a population with mean µ and variance σ2 then the sampling distribution of the sample mean tends to normal distribution with mean µ and variance σ2/n as sample size tends to large. This formula indicates that as the sample size increases, the spread of the sample means around the population mean decreases, with the standard deviation of the sample means shrinking proportionally to the square root of the sample size, and the variate Z,
where,
This formula quantifies how many standard deviations a data point (or sample mean) is away from the population mean. Positive z-scores indicate values above the mean, while negative z-scores indicate values below the mean. Follows the normal distribution with mean 0 and variance unity, that is, the variate Z follows standard normal distribution. According to the central limit theorem, the sampling distribution of the sample means tends to normal distribution as sample size tends to large (n > 30). Examples on Sampling DistributionExample 1: Mean and standard deviation of the tax value of all vehicles registered in a certain state are μ=$13,525 and σ=$4,180. Suppose random samples of size 100 are drawn from the population of vehicles. What are the mean μx̄ and standard deviation σx̄ of the sample mean x̄?Solution:
Example 2: A prototype automotive tire has a design life of 38,500 miles with a standard deviation of 2,500 miles. Five such tires are manufactured and tested. On the assumption that the actual population mean is 38,500 miles and the actual population standard deviation is 2,500 miles, find the probability that the sample mean will be less than 36,000 miles. Assume that the distribution of lifetimes of such tires is normal.Solution:
Practice Questions on Sample DistributionQ1: Random samples of size 225 are drawn from a population with mean 100 and standard deviation 20. Find the mean and standard deviation of the sample mean.Q2: Random samples of size 64 are drawn from a population with mean 32 and standard deviation 5. Find the mean and standard deviation of the sample mean.Q3: A population has mean 75 and standard deviation 12.
Q4: A population has mean 5.75 and standard deviation 1.02.
Q5: Numerical population of grade point averages at a college has mean 2.61 and standard deviation 0.5. If a random sample of size 100 is taken from the population, what is the probability that the sample mean will be between 2.51 and 2.71?Q6: Random samples of size 1,600 are drawn from a population in which the proportion with the characteristic of interest is 0.05. Decide whether or not the sample size is large enough to assume that the sample proportion is normally distributed.Q7: Random samples of size 225 are drawn from a population in which the proportion with the characteristic of interest is 0.25. Decide whether or not the sample size is large enough to assume that the sample proportion is normally distributed.FAQs on Sampling DistributionWhat are the 3 types of sampling distributions?
What are the steps for sampling distribution?
What are the characteristics of sampling distribution?
What is the difference between a normal distribution and a sampling distribution?
What is shape of sampling distribution of sample mean thickness?
What are factors that influence sampling distribution?
|

Reffered: https://www.geeksforgeeks.org
| Mathematics |
Type: | Geek |
Category: | Coding |
Sub Category: | Tutorial |
Uploaded by: | Admin |
Views: | 11 |