|
Combining multiple plots into one figure is a common task in data visualization, particularly when comparing or summarizing different aspects of data. grid. arrange() from the gridExtra package in R is an effective tool for this purpose, but saving the resulting arrangement to a file can be tricky for those unfamiliar with the right methods.
PrerequisitesBefore proceeding, ensure you have:
- R installed on your system.
- ggplot2 and gridExtra packages installed. You can install these packages using install.packages(“ggplot2”) and install.packages(“gridExtra”) if they are not already installed.
- Basic understanding of creating plots with ggplot2.
Overview of grid.arrange()The grid. arrange() function is part of the gridExtra package and is used to arrange multiple grid-based plots (like those created with ggplot2) on a single page. Unlike the par(mfrow = c(n, m)) in base R, grid.arrange() can handle complex grid arrangements and integrates better with ggplot2 aesthetics.
Step 1: Install and Load Necessary PackagesEnsure you have the ggplot2 and gridExtra packages installed. You can install them using install.packages() if you haven’t already.
R
install.packages("ggplot2")
install.packages("gridExtra")

library(ggplot2)
library(gridExtra)
Step 2: Create Sample PlotsFirst, create some sample ggplot2 plots to arrange and save.
R
# Create sample data
data(mpg)

# Create sample plots
plot1 <- ggplot(mpg, aes(x = displ, y = hwy)) +
  geom_point() +
  ggtitle("Plot 1")

plot2 <- ggplot(mpg, aes(x = class)) +
  geom_bar() +
  ggtitle("Plot 2")

plot3 <- ggplot(mpg, aes(x = drv, fill = class)) +
  geom_bar() +
  ggtitle("Plot 3")

plot4 <- ggplot(mpg, aes(x = displ, y = cty, color = drv)) +
  geom_point() +
  ggtitle("Plot 4")
Step 3: Arrange Plots Using grid.arrange()Use the grid.arrange() function from the gridExtra package to arrange the plots in a grid layout.
R
# Arrange the plots in a 2x2 grid
grid_plot <- grid.arrange(plot1, plot2, plot3, plot4, ncol = 2)
grid_plot
Output:
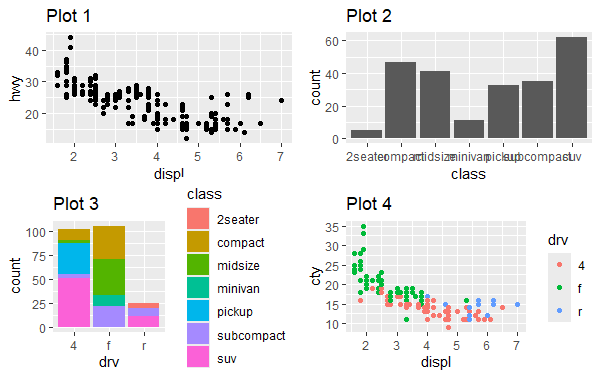 Saving grid.arrange() Plot to File in R Step 4: Save the Arranged Plot to a FileYou can save the arranged plot to a file using ggsave(). Since ggsave() works directly with ggplot objects, you need to use the grid.draw() function in combination with a graphics device like png() or pdf() for saving grid.arrange() plots.
R
# Create a grob from the arranged plots
grob <- arrangeGrob(plot1, plot2, plot3, plot4, ncol = 2)

# Use ggsave to save the grob
ggsave("grid_plot.png", grob, width = 8, height = 8)
Output:
 Saving grid.arrange() Plot to File in R Conclusiongrid.arrange() is an invaluable tool in R for combining multiple plots, and understanding how to save these arrangements into various formats ensures that your data visualizations are both presentable and shareable. With the methods described, you can easily integrate complex visualizations into your data analysis workflow, enhancing both the interpretability and accessibility of your results.
|