|
|
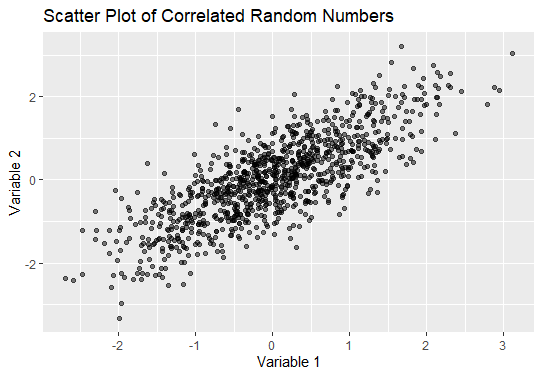
Generating correlated random numbers is a common task in statistical simulations and financial modeling. This article will walk you through the process of generating correlated random numbers in R Programming Language providing a comprehensive explanation and step-by-step examples. Understanding Correlated Random NumbersCorrelated random numbers are a set of random numbers that exhibit a specific correlation structure. Correlation measures the strength and direction of the relationship between two random variables. In the context of random number generation, you might need correlated random numbers to simulate real-world phenomena where variables are not independent. For example, in financial modeling, the returns of different stocks often show some degree of correlation. To simulate such scenarios accurately, you need to generate correlated random returns. Generate Correlated Random Numbers Using the MASS PackageThe MASS package in R provides functions to generate multivariate normal distributions, which can be used to create correlated random numbers. Step 1: Install and Load Necessary PackagesFirst we will install and load the Necessary Packages. Step 2: Define the Mean Vector and Covariance MatrixTo generate correlated random numbers, you need to specify the mean vector and the covariance matrix. The mean vector contains the means of each variable, and the covariance matrix defines the correlation structure. In this example, we have two variables with means of 0 and a covariance matrix indicating that the variables have a correlation of 0.8. Step 3: Generate Correlated Random NumbersUsing the mvrnorm function from the MASS package, you can generate correlated random numbers. Output: Variable1 Variable2 Step 4: Visualize the CorrelationYou can use a scatter plot to visualize the correlation between the two generated variables. Output: Generate Correlated Random Numbers in R ConclusionGenerating correlated random numbers in R is straightforward with the help of packages like MASS and mvtnorm. By defining the mean vector and covariance matrix, you can simulate real-world scenarios where variables exhibit correlation. The examples provided in this article demonstrate how to generate and visualize correlated random numbers, offering a solid foundation for further exploration and application in various fields. |
Reffered: https://www.geeksforgeeks.org
| R Language |
| Related |
|---|
| |
| |
| |
| |
| |
Type: | Geek |
Category: | Coding |
Sub Category: | Tutorial |
Uploaded by: | Admin |
Views: | 15 |